Spectrum Analysis
Contents
Concept
Automated signal census system that transforms raw radio spectrum data into classified, searchable signal inventories. Combines SDR acquisition, ML classification, and vector search to detect, identify, and catalog signals across monitored bands.
Visuals
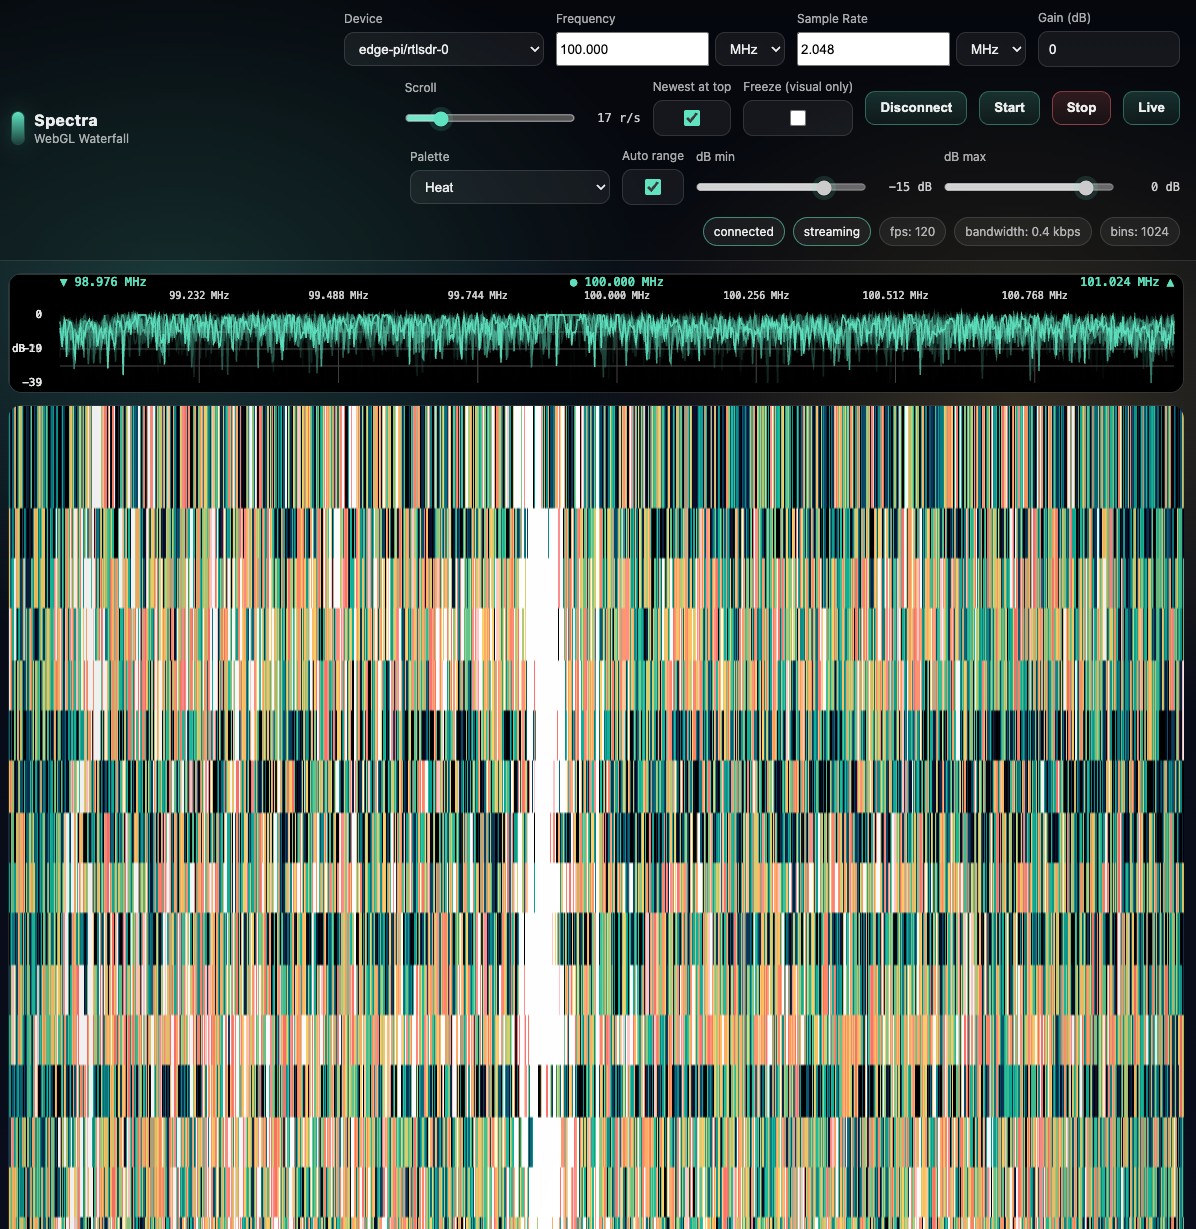
Waterfall & TUI Interface
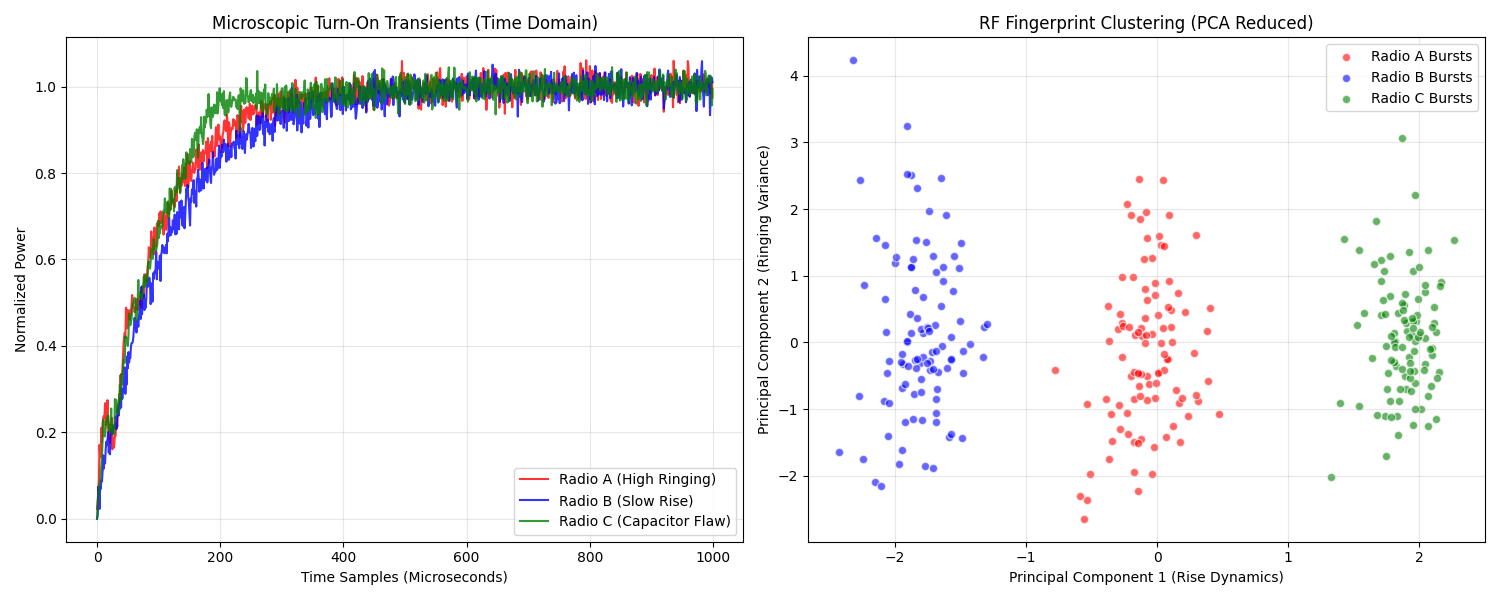
RF Fingerprinting Results
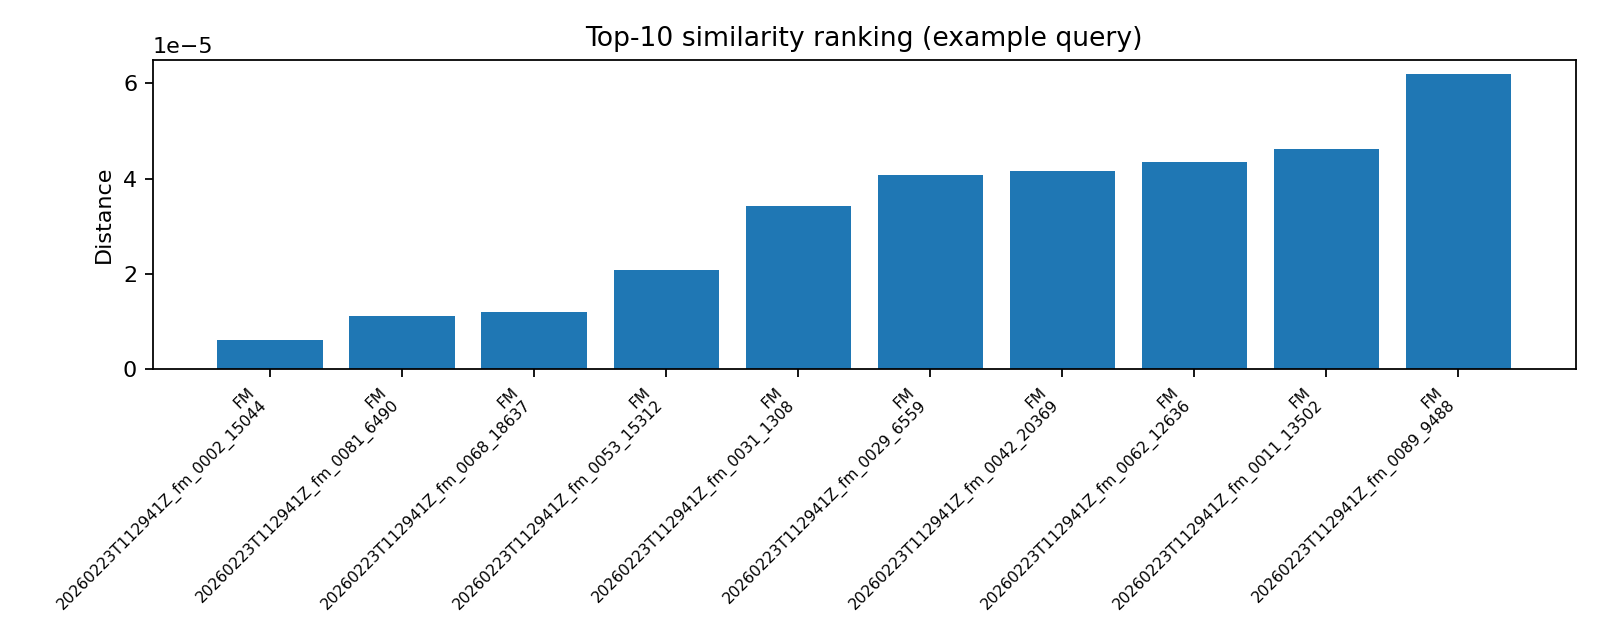
Vector Search (Top-K Matches)
Architecture
The Python backend owns all SDR connections and runs as a central server. IQ data is processed into spectrum bins, signal detections, classifications, and demodulated audio server-side — only compact results cross the wire to clients.
A multiplexed WebSocket protocol streams all data types (spectrum, detections, classifications, demod audio, control) to both the TUI and web interfaces. Users select a detected signal in either client, the backend classifies it, and results appear in real time.
Features
- Automated signal detection and ML classification
- Vector database indexing for signal fingerprint search (top-K matching)
- Audio content intelligence for demodulated signals
- Rust TUI with waterfall display and signal browser
- Web dashboard consuming the same WebSocket protocol
- Distributed acquisition across multiple SDR receivers
Quick Facts
| Status | Recently Updated |
| Stack | Python |
Core Value
Transform raw radio spectrum data into an actionable “Signal Census” through automated detection, ML classification, and distributed acquisition.
Current Milestone: v2.0 — Central Server Integration
Goal: Make the Python backend the single central server that owns all SDR connections, processes IQ into spectrum/classifications/demod, and streams compact results to thin clients (TUI + Web) over WebSocket. No raw IQ crosses the wire to clients. No double handling.
Target features:
- Multiplexed WebSocket protocol (spectrum bins + signal detections + classifications + demod audio + control)
- Python backend enrichment: single-connection SDR ownership, on-demand classification, demod streaming
- TUI advanced mode: receives pre-processed spectrum from Python backend (basic mode preserved)
- Web client updates: consumes same WebSocket protocol as TUI
- End-to-end flow: user selects signal in TUI/Web → Python classifies → result displayed
Stakeholders
- User: Solo operator/developer
Constraints & Assumptions
- Edge Hardware: Raspberry Pi 4/5.
- SDRs:
- Airspy R2 (Primary Scanner)
- Airspy HF Discovery (HF/LF)
- KrakenSDR (5-channel phase-coherent for DoA)
- RTL-SDR (Utility/ADS-B)
- Antennas:
- TA1 Turnstile (Satellite/VHF)
- Diamond D-130 Discone (Broadband Scanner)
- MLA-30 Loop (LF/HF)
- RF Chain: Mini-Kits LNA for Satellite reception.
- Core Hardware: Mac mini M-Series (Processing/ML/Storage).
- Network: Low-latency local network for IQ streaming.
- ML: Leverages Mac Neural Engine.
Current Status
** 2026-03-10 — Completed (3D Propagation Bounce Visualization).