Data Analytics & Visualization
Two engines for the point where conventional tools stop scaling: rendering spatial datasets too dense to draw point-by-point, and finding structure in time series too long to scan by eye. Both are written in Rust, run from the CPU with optional GPU paths, and integrate with the Polars dataframe ecosystem.
Contents
- How They Work Together
- DataRaster — Dense Spatial Rendering
- matrix-profile-rs — Time Series Pattern Discovery
How They Work Together
Parquet · CSV · cloud object stores"] SRC --> DR["DataRaster
dense spatial rendering"] SRC --> MP["matrix-profile-rs
time-series pattern discovery"] DR --> O1["Density maps · raster tiles · analysis layers"] MP --> O2["Motifs · discords · annotated profiles"]
The two tools address different shapes of data — spatial extent and temporal sequence — but share a stance: keep the heavy computation in a compiled engine, expose it through a dataframe-first API, and return results fast enough to explore interactively rather than in overnight batches.
DataRaster — Dense Spatial Rendering
Active · Rust Python WASM · Full Details →
DataRaster turns massive spatial datasets into density maps, raster tiles, and analysis outputs. It is built for the point where browser-side SVG, notebook scripts, and hand-rolled Python pipelines stop scaling: a compiled backend for dense point, line, and polygon rendering. If you know Datashader, the framing is direct — DataRaster is a deployment-friendly backend for the same class of problem, with a tile server, Python bindings, and diagnostics built around it.
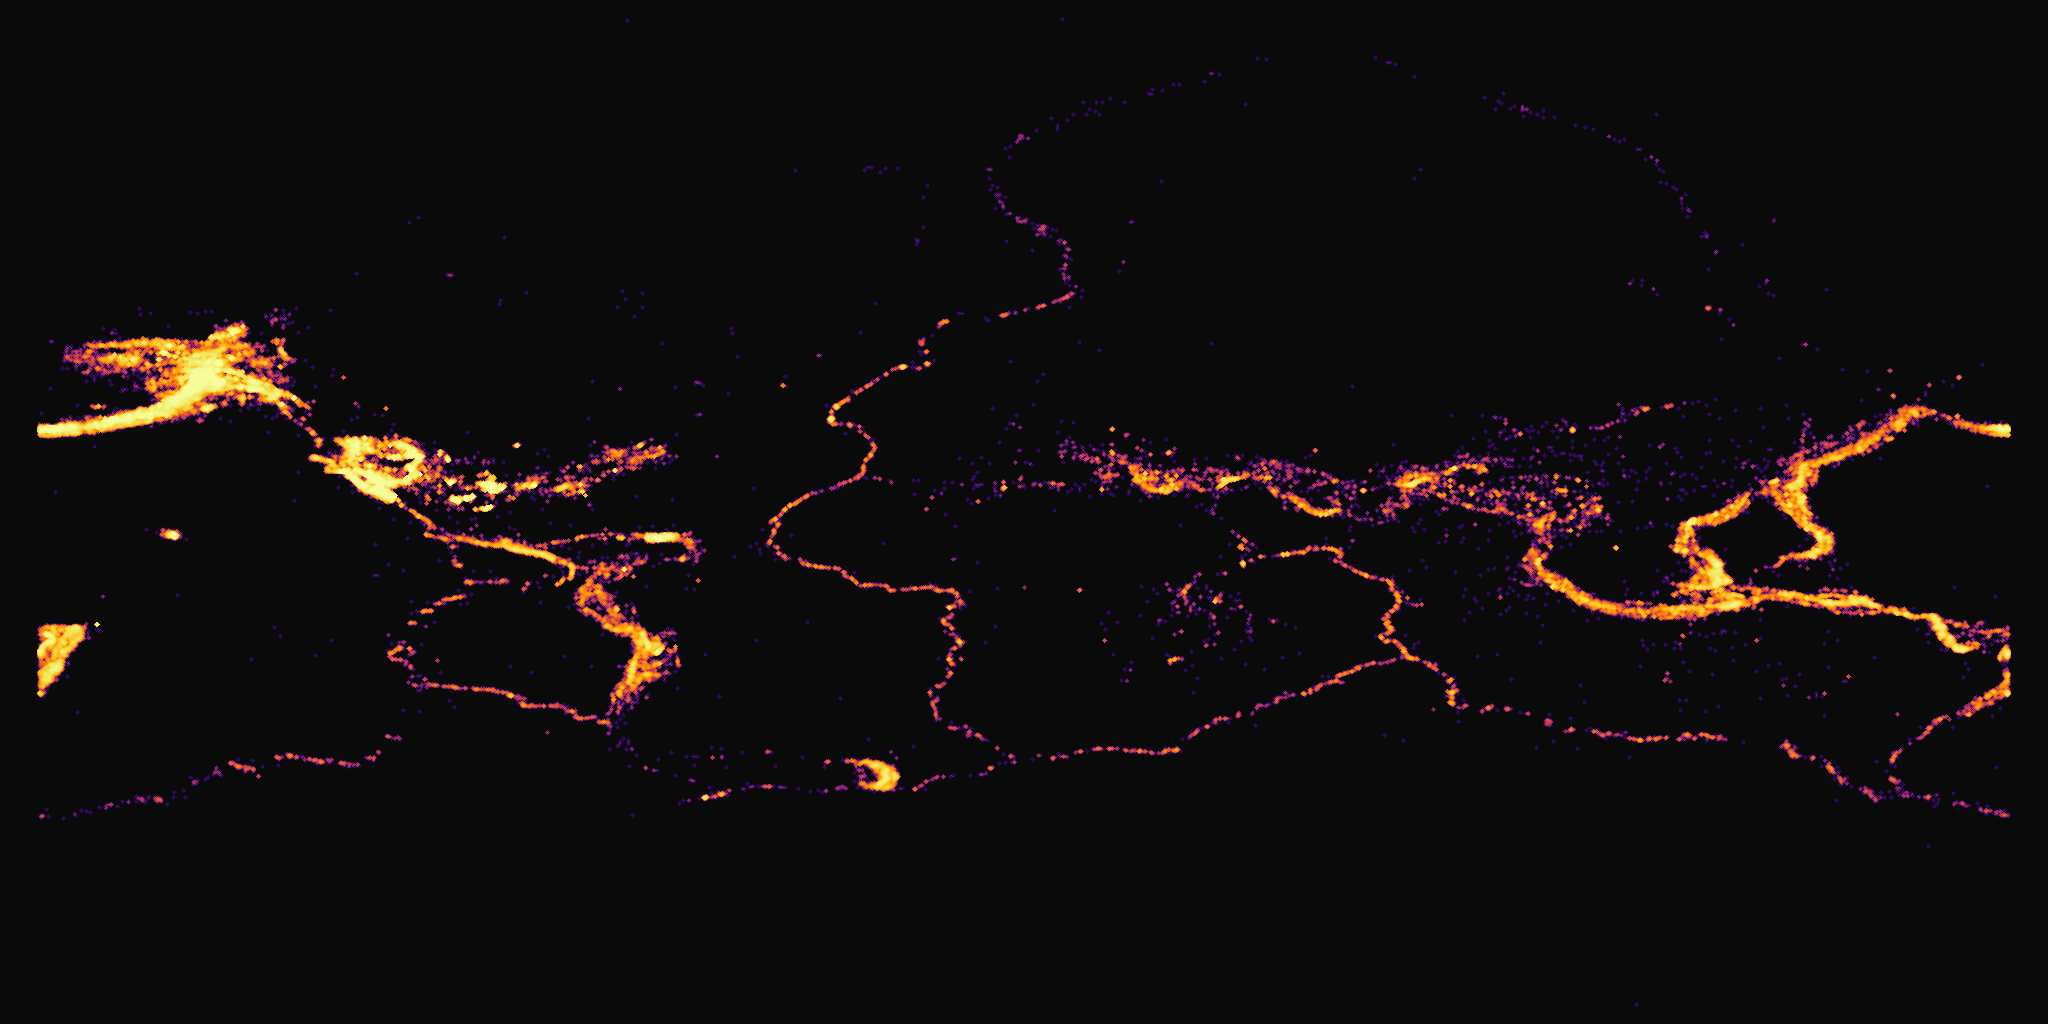 Every recorded earthquake epicentre, rendered as a density map. Tectonic plate
boundaries emerge from the raw point cloud — no point-by-point drawing, no
pre-aggregation.
Every recorded earthquake epicentre, rendered as a density map. Tectonic plate
boundaries emerge from the raw point cloud — no point-by-point drawing, no
pre-aggregation.
The engine is a ten-crate Rust workspace — roughly 60,000 lines — spanning the
core renderer, a CLI, a tile server, Python bindings, a WASM build, and a Polars
plugin. Rendering runs on the CPU with an optional wgpu GPU path. Beyond density
maps it does spatial analysis (contours, peaks, hotspots, change detection),
multi-layer compositing, bivariate rendering, and edge bundling. Semantic zoom
switches a view from aggregate heatmap to individual points once density drops
below a threshold, blending the two across a transition band.
From a raw Parquet file, one command probes the data, picks columns, and recommends a transfer function and colormap:
data-raster auto data/points.parquet -o out.png
The same engine drives a Python workflow, taking Polars or pandas frames directly:
import data_raster
import polars as pl

df = pl.read_parquet("trips_10M.parquet")
data_raster.render_to_file(
    df, "x", "y",
    output="trips.png",
    transfer="eq_hist",
    colormap="plasma",
)
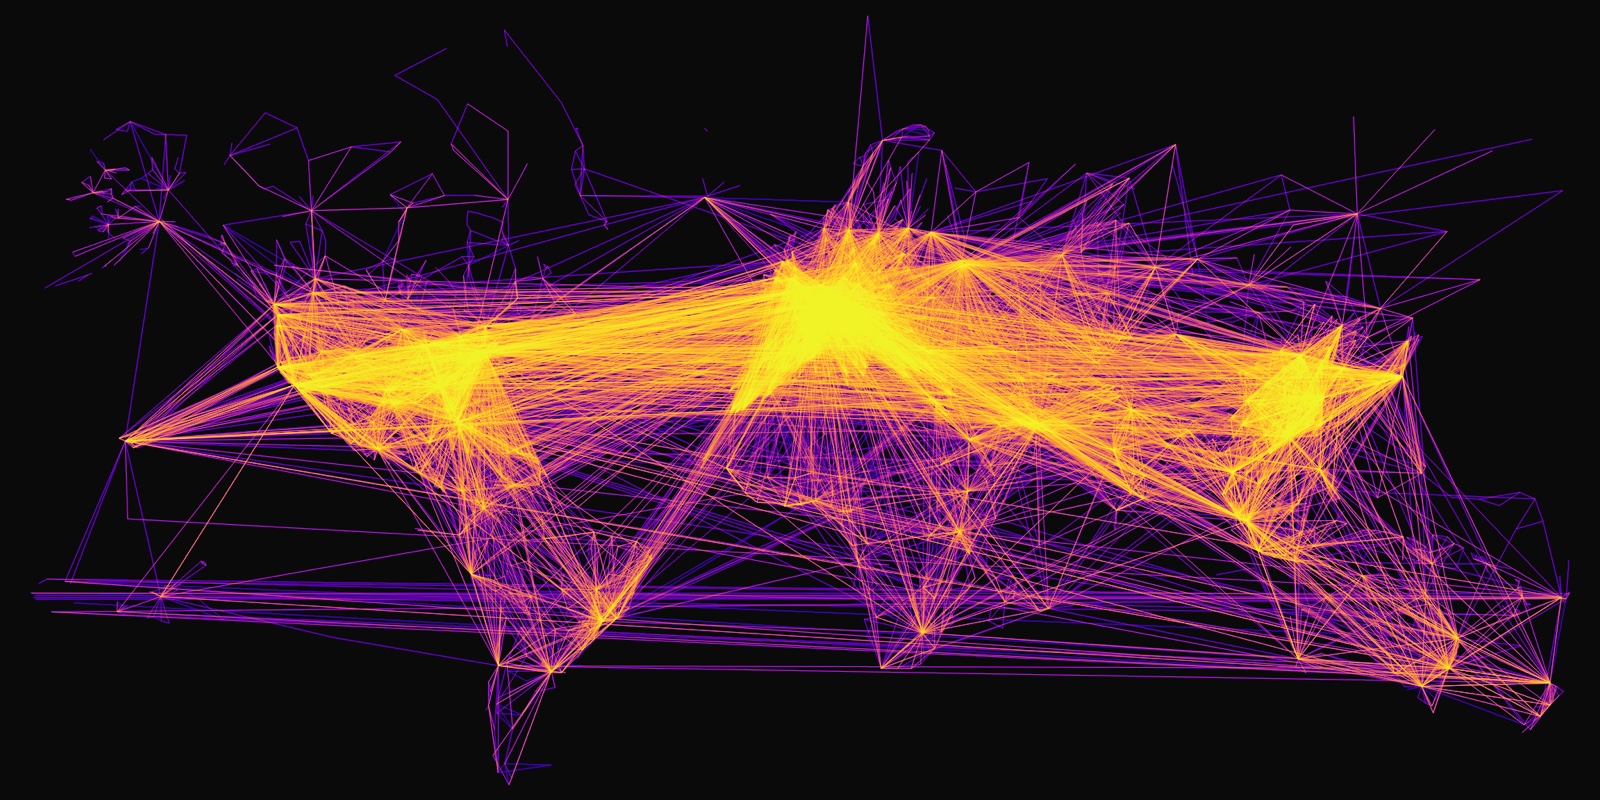 Line rendering: hundreds of thousands of great-circle flight paths aggregated
into a single density layer.
Line rendering: hundreds of thousands of great-circle flight paths aggregated
into a single density layer.
Datasets are read straight from Parquet and CSV, including from S3, R2, GCS, and Azure Blob Storage as first-class sources — so the same backend serves a local file and a cloud-hosted table without a separate ingestion step.
matrix-profile-rs — Time Series Pattern Discovery
Recently Updated · Rust Polars · Full Details →
The matrix profile is a single transform that exposes a time series’ repeated patterns and its anomalies. It annotates every subsequence with the distance to its nearest match elsewhere in the series: low values mark motifs (a shape that recurs), high values mark discords (a shape unlike any other). It needs no training, no labelled data, and no domain-specific parameters.
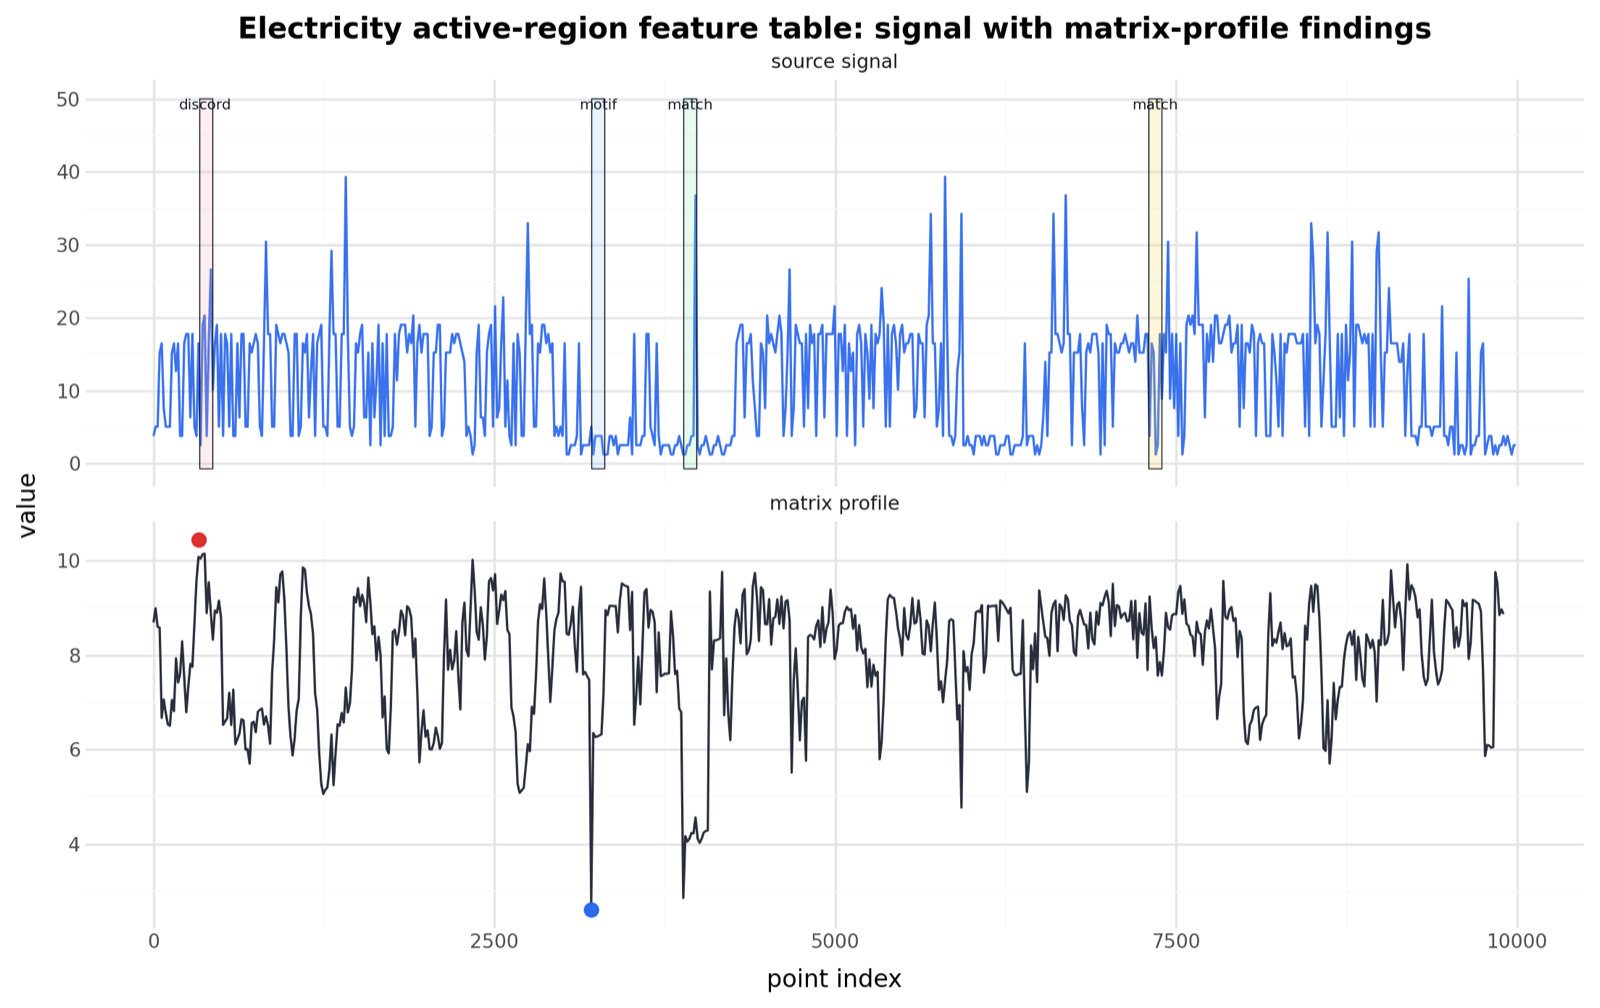 Top: an electricity-demand signal with the discovered discord and matching
motifs boxed. Bottom: the matrix profile itself — its lowest point locates the
strongest motif, its highest point the clearest anomaly.
Top: an electricity-demand signal with the discovered discord and matching
motifs boxed. Bottom: the matrix profile itself — its lowest point locates the
strongest motif, its highest point the clearest anomaly.
matrix-profile-rs implements the STOMP, SCAMP, and SCRIMP++ algorithms in native Rust — 8,700 lines, 58 tests. SIMD kernels (AVX2 and NEON) give a 2.5x speedup over the scalar path, and memory-budgeted tiling keeps series larger than RAM within a fixed footprint. A Polars plugin exposes the computation as a native dataframe operation, so motif and discord discovery composes with the rest of an analysis pipeline rather than sitting outside it.
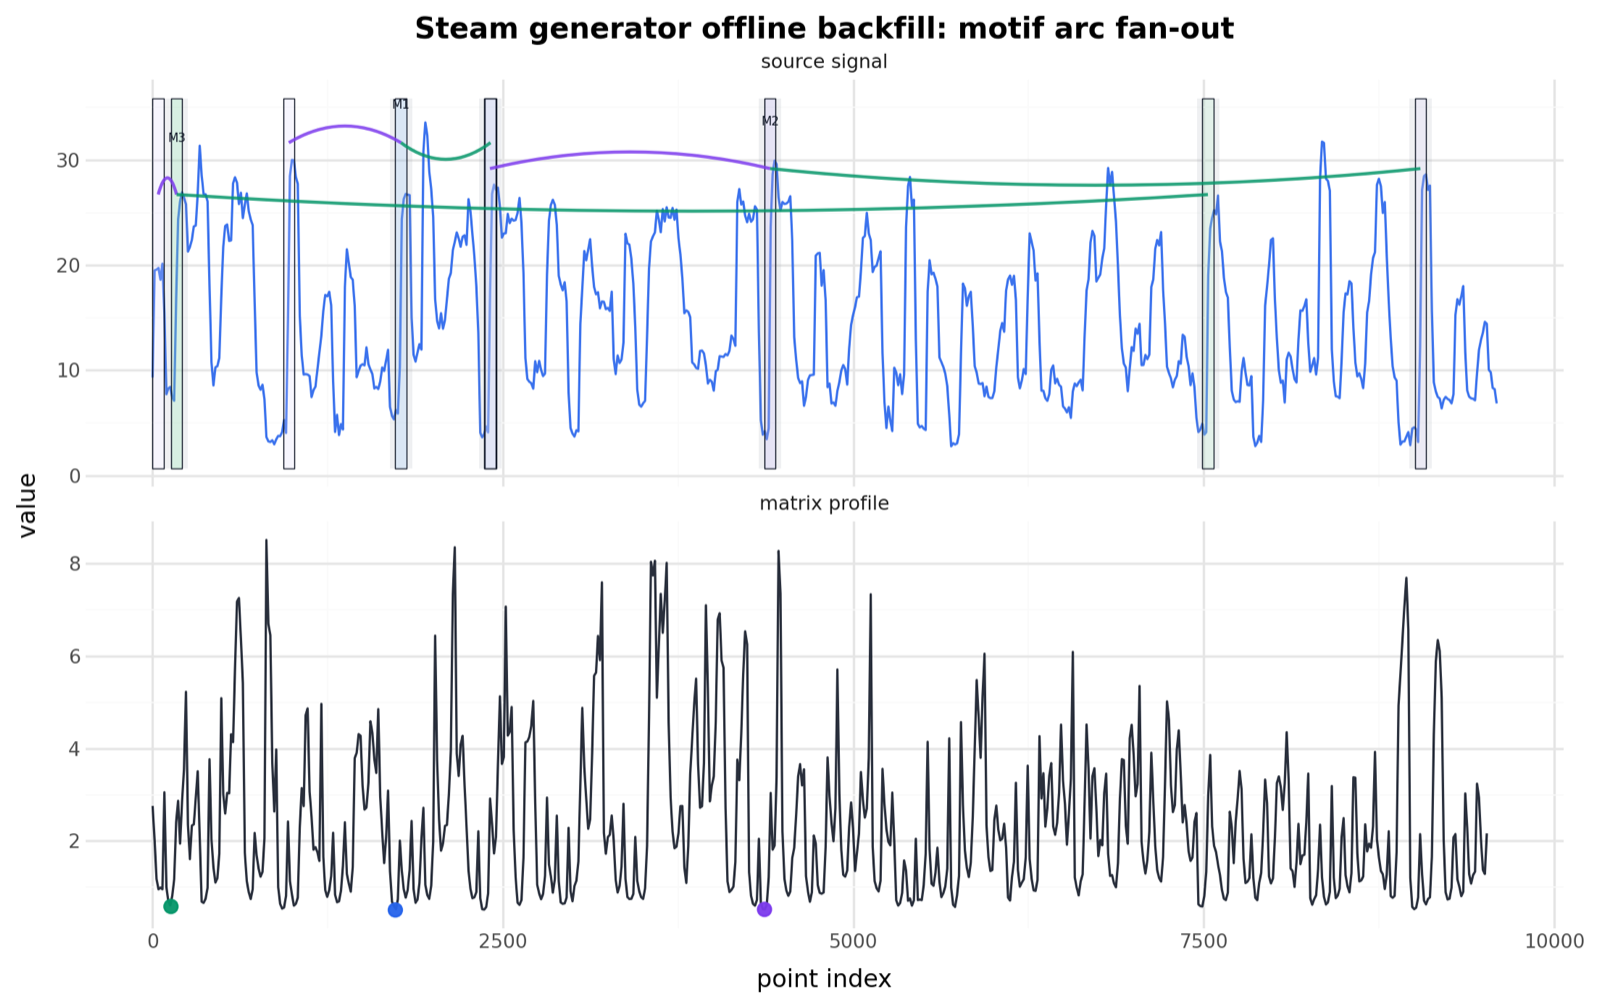 Motif arc fan-out: arcs connect each occurrence of a recurring shape across a
steam-generator sensor trace, with the matrix profile below.
Motif arc fan-out: arcs connect each occurrence of a recurring shape across a
steam-generator sensor trace, with the matrix profile below.
| ← Back to Projects | Signal Processing | Photography | Autonomous Systems |