DataRaster
Concept
DataRaster turns massive spatial datasets into density maps, raster tiles, and analysis layers. It is a compiled backend for the kind of dense point, line, and polygon rendering that browser-side SVG and notebook-driven Python pipelines stop scaling at.
The shortest framing, for anyone who knows Datashader: DataRaster is a deployment-friendly backend for the same class of dense spatial rendering, with a tile server, Python bindings, and diagnostics built around it. It reads source data — Parquet or CSV, directly from S3, R2, GCS, or Azure Blob — and renders or serves without an intermediate ingestion step.
Visuals
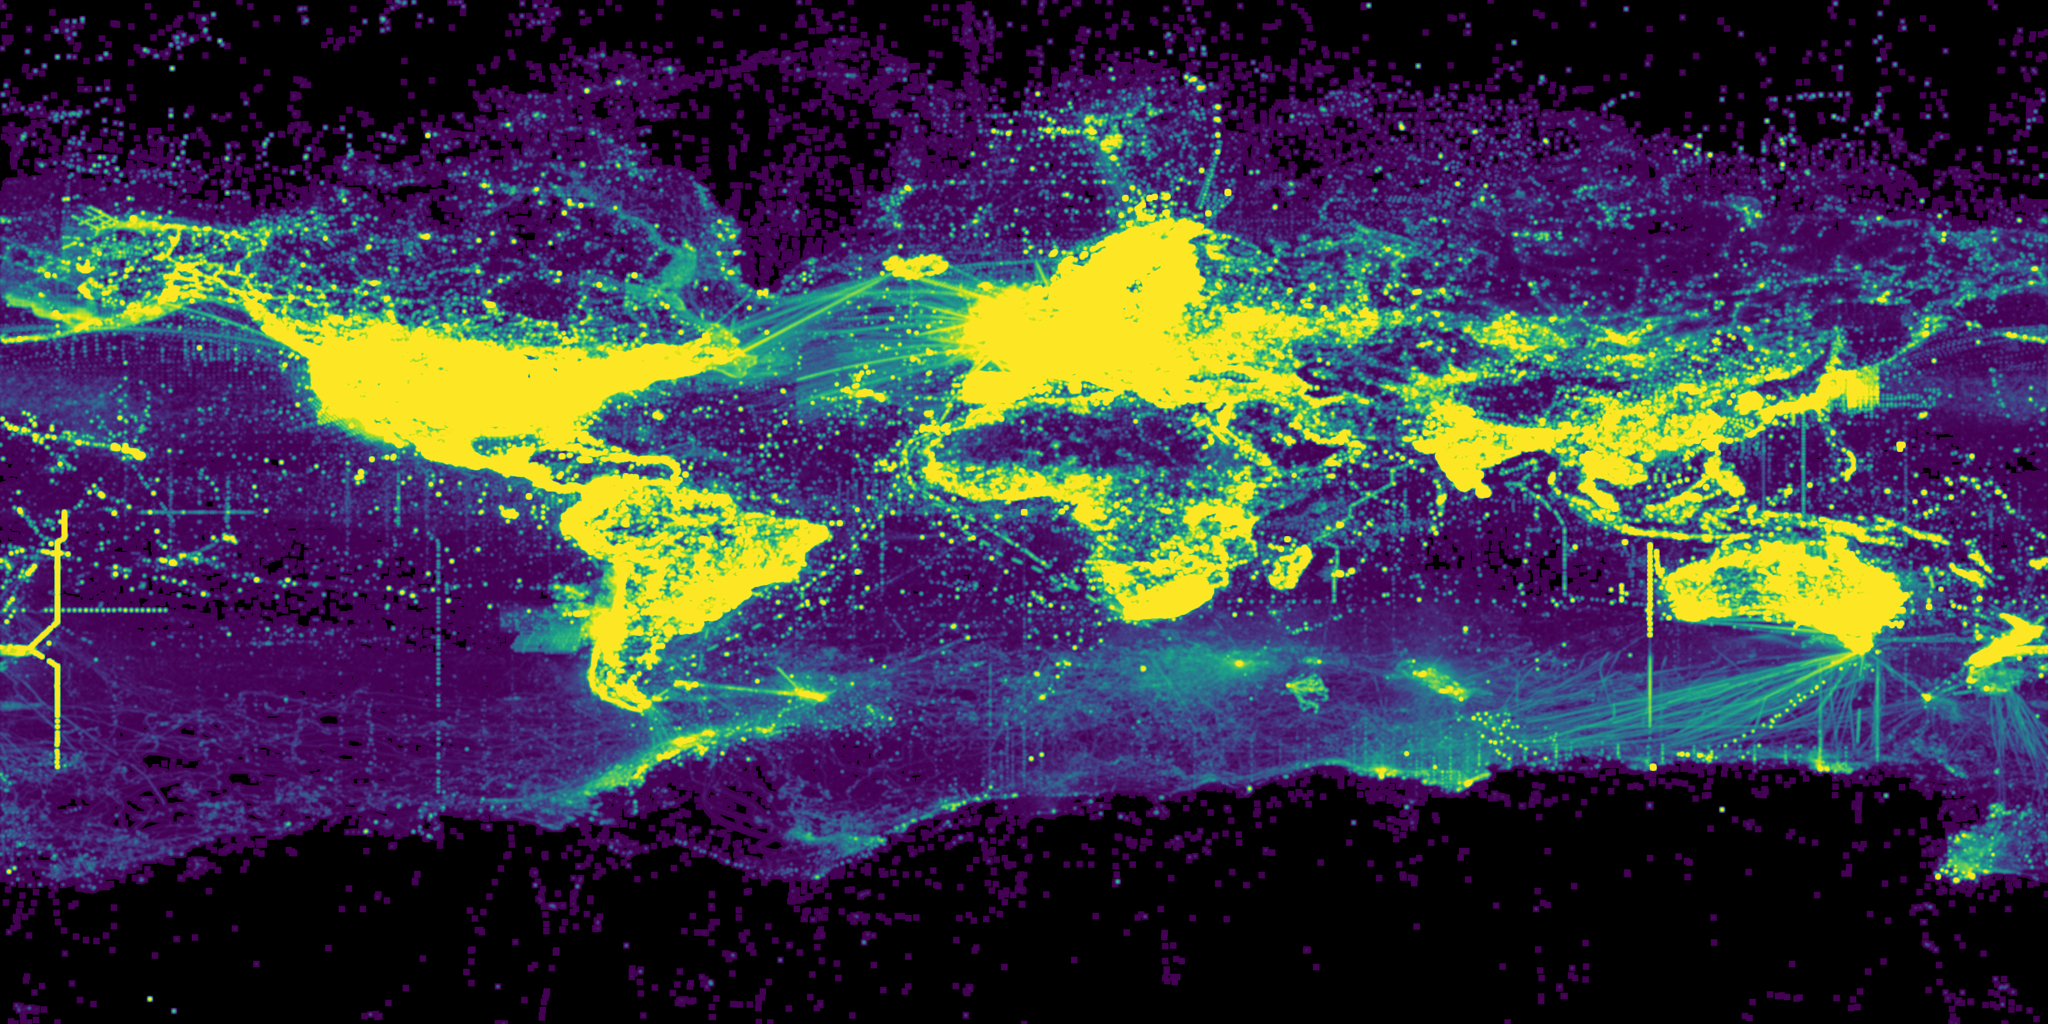 Every recorded species occurrence on the planet — 3.62 billion observations from the GBIF open-data release — collapsed into one smooth density surface. The full render takes about four minutes on a single workstation (239.62 s for the smoothed KDE version, 38 s for the count-only version). The kind of figure that usually requires a cluster, drawn from raw Parquet on one machine.
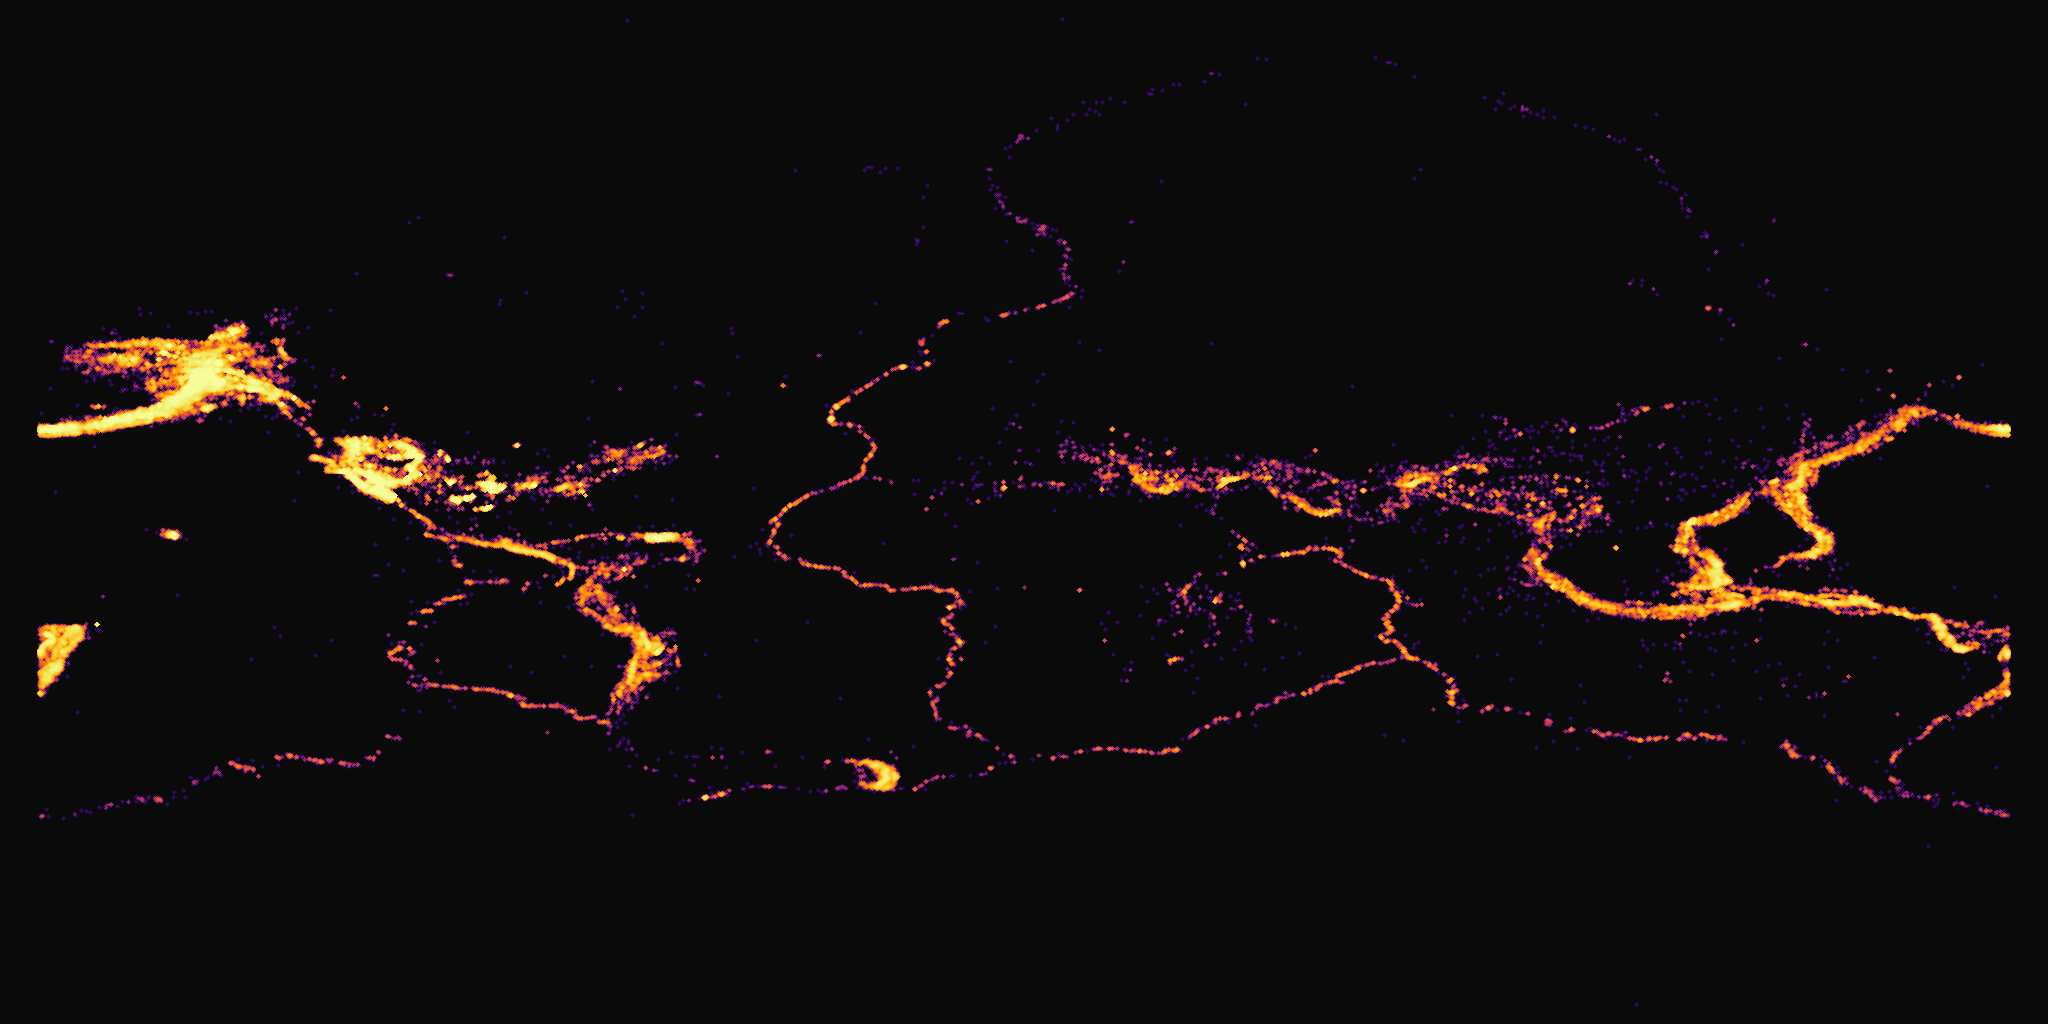 Every earthquake on record — 782,000 events — as a single density layer. The Pacific Ring of Fire, the Mid-Atlantic Ridge, and the Indonesian arc all surface from the raw catalogue with no manual cartography.
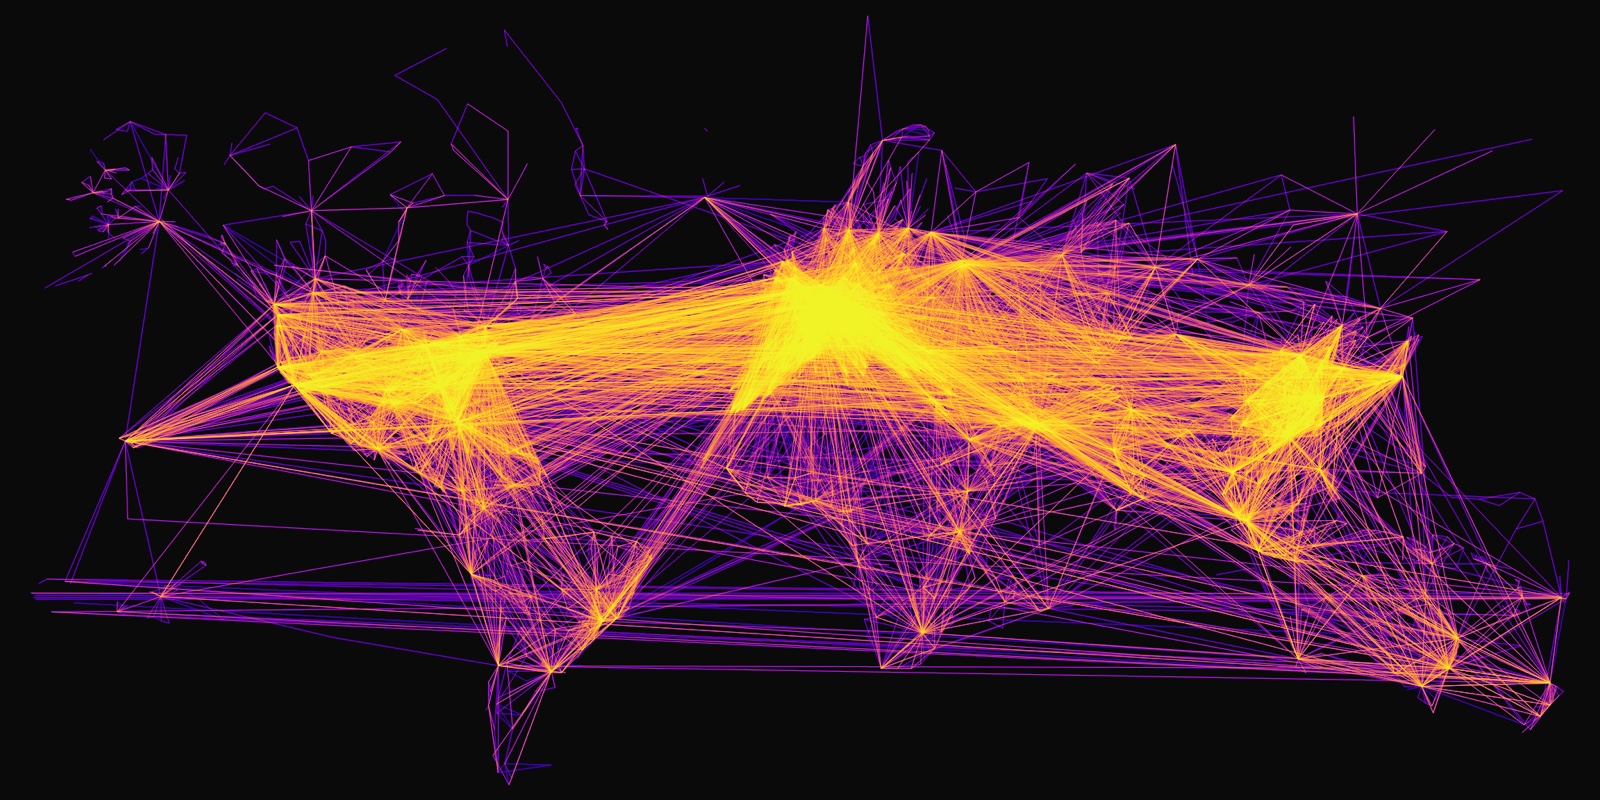 The global airline network — 67,000 great-circle routes — aggregated into one line-density layer. Major hubs, transoceanic corridors, and underserved regions are all visible at the same zoom level.
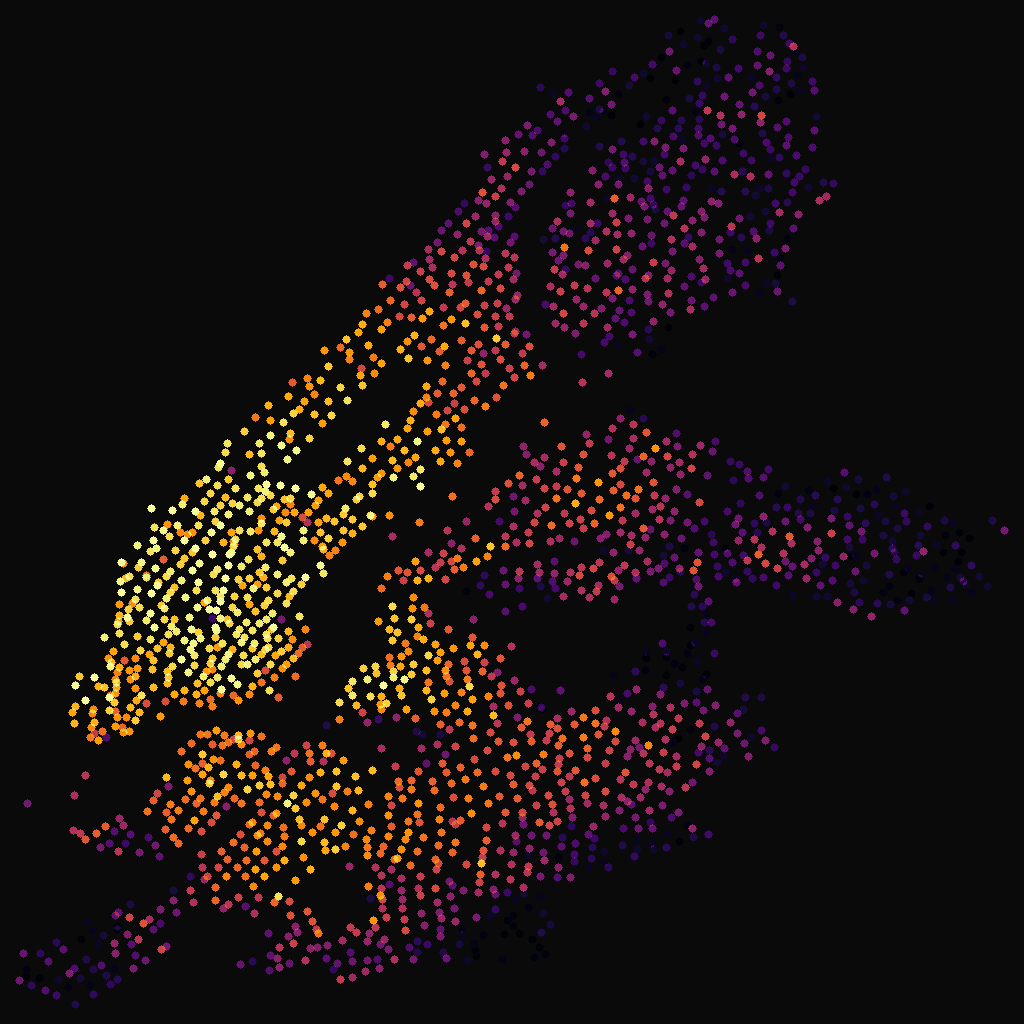 5.1 million Citibike trip starts in a single month. The morning commute, the Brooklyn waterfront, and the bridge bottlenecks all appear at city scale without any per-point drawing.