Network Visualization Engine
Contents

Concept
Rust-based network topology layout and visualization engine. Takes multi-layer network topologies (via petgraph) and renders them using layout algorithms that minimize edge crossings, bundle related connections, and respect hierarchical or geographic structure. Outputs SVG, PDF, and PNG with interactive browser embedding via WASM.
Design follows Tufte’s principles: maximize information density, minimize chartjunk. An automated WCAG 3:1 contrast system ensures accessibility without manual tuning.
Sources] --> L[Layout
Algorithms] L --> R[Renderer] R --> SVG[SVG] R --> PDF[PDF] R --> PNG[PNG] R --> WASM[WASM
Browser]
Technical Reports
Code Samples
README.md
# Adapter Examples

This directory contains runnable scripts that demonstrate the end-to-end workflow:

external data -> `netvis import` -> topology YAML -> `netvis --input` -> SVG

All outputs are written to `target/` (gitignored by default).

## LLDP/CDP discovery JSON

Script: `examples/adapters/lldp-import.sh`

Runs an LLDP import from a JSON file and renders an SVG.

Run (from repo root):

```bash
bash examples/adapters/lldp-import.sh
Optional: pass a custom discovery JSON path:
bash examples/adapters/lldp-import.sh /path/to/discovery.json
Expected outputs:
target/lldp-imported.yamltarget/lldp-imported.svg
Sample input: examples/adapters/sample-lldp.json
NetBox
Script: examples/adapters/netbox-import.sh
Requires a NetBox API token via env var (the script never prints it).
Environment variables:
NETBOX_TOKEN(required)NETBOX_URL(recommended)
Run:
export NETBOX_URL=https://netbox.example.com
export NETBOX_TOKEN=...   # read-only token
bash examples/adapters/netbox-import.sh
You can also pass the NetBox URL as the first argument to override NETBOX_URL:
bash examples/adapters/netbox-import.sh https://netbox.example.com
Expected outputs:
target/netbox-imported.yamltarget/netbox-imported.svg
Notes
- These scripts run
cargo run --features cli --bin netvis .... The first run may take a while to compile. - If you have a
netvisbinary on your PATH already, you can run the equivalentnetvis import ...commands directly.
### pdf-export.yaml

```yaml
# PDF Export Configuration for Documents and Presentations
#
# This YAML shows recommended PDF export settings for different use cases.
# Use with the Rust API: PdfOptions::default().page_size(...).title(...)
#
# For CLI usage, the output file extension (.pdf) triggers PDF export:
#   netvis --input topology.yaml --output diagram.pdf
#
# The settings below document PdfOptions API fields.

# Document Metadata (embedded in PDF properties)
metadata:
  title: "Network Topology Diagram"
  author: "NetVis"
  subject: "Infrastructure Documentation"
  keywords: "network, topology, diagram"

# Page Settings
page_size: content_size   # Options: content_size (default), a4, letter, custom
# For custom size:
# page_size:
#   custom:
#     width_mm: 297
#     height_mm: 210

# Margins (in millimeters)
margins_mm: 5.0

# DPI for coordinate mapping (default: 72.0)
dpi: 72.0

# Recommended render settings for PDF output
render:
  theme: print            # Print theme has high contrast for paper
  width: 1200
  height: 900

# Use Cases:
#
# 1. Technical Documentation:
#    - page_size: a4 or letter
#    - margins_mm: 10-15 for binding
#    - theme: print (black lines on white)
#
# 2. Presentations:
#    - page_size: content_size (fits slide exactly)
#    - theme: light or network
#    - Larger width (1600+) for detail
#
# 3. Posters/Large Format:
#    - page_size: custom (A1, A0, etc.)
#    - margins_mm: 20+
#    - High DPI (150-300) for quality
png-print.yaml
# PNG Export Configuration for High-Quality Printing
#
# This YAML shows recommended PNG settings for print output.
# Optimized for physical documents, posters, and professional printing.
#
# Use with the Rust API: PngOptions::default().dpi(300).scale(2.0)...
#
# CLI export example:
#   netvis --input topology.yaml --output diagram.png --width 2550 --height 3300
#
# The settings below document PngOptions API fields.

# High Resolution for Print
dpi: 300                  # Print standard (300 DPI minimum)
scale: 2.0                # 2x rasterization for crisp edges

# Dimensions (pixels at 300 DPI)
# Letter size: 8.5" x 11" at 300 DPI = 2550 x 3300 pixels
# A4 size: 210mm x 297mm at 300 DPI = 2480 x 3508 pixels
width: 2550
height: 3300

# Quality Settings
compression: high         # Best compression for archival quality
                          # Larger file but maximum quality

# Background for Paper
background: white         # White for standard paper printing
                          # Use theme background color for specialty paper

# Antialiasing
antialias: true           # Smooth edges are critical for print

# Recommended render settings for print
render:
  theme: print            # High contrast, optimized for paper
  width: 1200             # Scene width (scaled to print dimensions)
  height: 900
  labels: label

# Common Print Sizes at 300 DPI:
#
# Letter (8.5" x 11"):
#   width: 2550, height: 3300 (portrait)
#   width: 3300, height: 2550 (landscape)
#
# A4 (210mm x 297mm):
#   width: 2480, height: 3508 (portrait)
#   width: 3508, height: 2480 (landscape)
#
# Tabloid (11" x 17"):
#   width: 3300, height: 5100
#
# A3 (297mm x 420mm):
#   width: 3508, height: 4961
#
# Use Cases:
#
# 1. Technical Document Insert:
#    - width: 2550, height: 1800 (half page)
#    - dpi: 300
#    - theme: print
#
# 2. Wall Poster (A1/A0):
#    - width: 7016+ (A1 at 300 DPI)
#    - dpi: 150-200 (can reduce for very large)
#    - scale: 3.0 or higher
#
# 3. Presentation Handout:
#    - dpi: 150 (sufficient for handouts)
#    - compression: balanced
png-web.yaml
# PNG Export Configuration for Web Display
#
# This YAML shows recommended PNG settings for web/screen use.
# Optimized for dashboards, documentation sites, and embedding.
#
# Use with the Rust API: PngOptions::default().dpi(72).compression(...)
#
# CLI export is automatic when output ends in .png:
#   netvis --input topology.yaml --output diagram.png --width 1200 --height 800
#
# The settings below document PngOptions API fields.

# Resolution
dpi: 72                   # Web standard (72 or 96 DPI)
scale: 1.0                # 1x for web, 2x for retina

# Dimensions (in pixels)
width: 1200
height: 800

# Compression
compression: fast         # Options: fast, balanced (default), high
                          # 'fast' is fine for web - smaller file, quick load

# Background
background: white         # Options: white, transparent, or hex color (#rrggbb)
                          # Use 'transparent' for overlays on colored backgrounds

# Antialiasing
antialias: true           # Always true for smooth edges on screen

# Recommended render settings for web PNG
render:
  theme: dark             # Dark theme common for dashboards/NOC displays
  width: 1200
  height: 800
  labels: label

# Use Cases:
#
# 1. Dashboard/NOC Display:
#    - theme: dark
#    - width: 1920, height: 1080 (full HD)
#    - scale: 1.0
#
# 2. Documentation Site:
#    - theme: light
#    - width: 800-1200
#    - compression: fast
#    - background: white
#
# 3. Retina/HiDPI Display:
#    - scale: 2.0 (doubles pixel count)
#    - Keeps file sizes reasonable with good quality
#
# 4. Email Attachment:
#    - width: 800 (smaller for email clients)
#    - compression: high
#    - background: white
README.md
# NetVis Example Gallery

This directory contains pre-rendered SVG outputs for layout template examples and the v1.2 visual effects showcase.

## v1.2 Effects Showcase

The gallery demonstrates visual effects (drop shadows, glow) across different topology types and real-world scenarios.

### Topology Types

| Topology | File | Description |
|----------|------|-------------|
| Mesh | `gallery-mesh-effects.yaml` | Dense mesh with emphasis on critical paths |
| Ring | `gallery-ring-effects.yaml` | Ring topology with root node highlight |
| Tree | `gallery-tree-effects.yaml` | Hierarchical layout with tiered shadows |
| Geographic | `gallery-geo-effects.yaml` | WAN with geographic positioning |

### Effect Comparison

| File | Purpose |
|------|---------|
| `gallery-effects-comparison.yaml` | Side-by-side comparison of no effects, subtle, and emphasis |

### Real-World Scenarios

| Scenario | File | Key Effects |
|----------|------|-------------|
| Datacenter | `gallery-datacenter-realworld.yaml` | Spine emphasis, firewall glow |
| Campus | `gallery-campus-realworld.yaml` | Core emphasis, wireless controller glow |
| WAN | `gallery-wan-realworld.yaml` | HQ selection glow, regional hierarchy |

### Rendering Gallery Examples

All examples render in both light and dark themes:

```bash
# Light theme
netvis -i examples/topologies/gallery-mesh-effects.yaml --theme light -o examples/outputs/gallery-mesh-effects-light.svg

# Dark theme
netvis -i examples/topologies/gallery-mesh-effects.yaml --theme dark -o examples/outputs/gallery-mesh-effects-dark.svg
Available Effects
drop-shadow-subtle: Subtle depth for secondary elementsdrop-shadow-emphasis: Strong depth for primary elementsglow-selection: Highlight selected/active elements
Template Example Outputs
Pre-rendered SVG outputs for all layout template examples.
Files
Spine-Leaf Template
template-spine-leaf-small.svg(12 nodes) - 2-tier datacenter fabrictemplate-spine-leaf-medium.svg(30 nodes) - 3-tier fabric with podstemplate-spine-leaf-large.svg(556 nodes) - 5-tier mega datacenter
Hub-Spoke Template
template-hub-spoke-small.svg(9 nodes) - Enterprise WANtemplate-hub-spoke-medium.svg(25 nodes) - Global regional hierarchytemplate-hub-spoke-large.svg(620 nodes) - Global enterprise WAN
Ring Template
template-ring-small.svg(8 nodes) - Campus backbone ringtemplate-ring-medium.svg(20 nodes) - Metro dual ringtemplate-ring-large.svg(500 nodes) - 5 metro transport rings
Multi-Tier Template
template-multi-tier-small.svg(10 nodes) - 3-tier web apptemplate-multi-tier-medium.svg(35 nodes) - Production microservicestemplate-multi-tier-large.svg(550 nodes) - Large Kubernetes cluster
How to Regenerate
To regenerate these outputs, run:
# Small/Medium examples with template specified
netvis --input examples/topologies/template-spine-leaf-small.yaml --template spine-leaf --output examples/outputs/template-spine-leaf-small.svg
netvis --input examples/topologies/template-hub-spoke-small.yaml --template hub-spoke --output examples/outputs/template-hub-spoke-small.svg
netvis --input examples/topologies/template-multi-tier-small.yaml --template multi-tier --output examples/outputs/template-multi-tier-small.svg

# Ring uses force_directed from the YAML file
netvis --input examples/topologies/template-ring-small.yaml --output examples/outputs/template-ring-small.svg

# Large examples (500+ nodes each)
netvis --input examples/topologies/template-spine-leaf-large.yaml --template spine-leaf --output examples/outputs/template-spine-leaf-large.svg
netvis --input examples/topologies/template-hub-spoke-large.yaml --template hub-spoke --output examples/outputs/template-hub-spoke-large.svg
netvis --input examples/topologies/template-ring-large.yaml --output examples/outputs/template-ring-large.svg
netvis --input examples/topologies/template-multi-tier-large.yaml --template multi-tier --output examples/outputs/template-multi-tier-large.svg
Notes
- Ring examples use
layout: force_directedinstead of the ring template because the radial layout algorithm requires tree-like graphs, and rings have cycles. - Large examples (500+ nodes) are programmatically generated and may take 1-2 seconds to render.
- All SVG files can be viewed in any modern web browser.
### quality-report.md

```markdown
# SVG Quality Analysis Report

**Files analyzed:** 8

## Summary

| File | Status | Text | Font Range | Overlaps | Vision | Issues | Warnings |
|------|--------|------|------------|----------|--------|--------|----------|
| gallery-effects-comparison-light.svg | ISSUES | 21 | 9-22px | 32 | - | 2 | 1 |
| gallery-campus-realworld-light.svg | ISSUES | 32 | 14-22px | 18 | - | 1 | 1 |
| gallery-geo-effects-light.svg | ISSUES | 9 | 11-11px | 2 | - | 1 | 0 |
| gallery-mesh-effects-light.svg | ISSUES | 31 | 14-22px | 10 | - | 1 | 1 |
| gallery-ring-effects-light.svg | ISSUES | 21 | 14-22px | 22 | - | 1 | 1 |
| gallery-wan-realworld-light.svg | ISSUES | 15 | 14-14px | 14 | - | 1 | 1 |
| gallery-datacenter-realworld-light.svg | OK | 0 | - | 0 | - | 0 | 0 |
| gallery-tree-effects-light.svg | OK | 0 | - | 0 | - | 0 | 0 |

## Issues Requiring Attention

### gallery-campus-realworld-light.svg

- 6 critical text overlap(s) (> overlap)

### gallery-effects-comparison-light.svg

- 9 text element(s) with font-size < 10px (too small)
- 18 critical text overlap(s) (> overlap)

### gallery-geo-effects-light.svg

- 2 critical text overlap(s) (> overlap)

### gallery-mesh-effects-light.svg

- 6 critical text overlap(s) (> overlap)

### gallery-ring-effects-light.svg

- 6 critical text overlap(s) (> overlap)

### gallery-wan-realworld-light.svg

- 6 critical text overlap(s) (> overlap)
README.md
# Rendering Verification Artifacts

These files are generated to visually verify NetVis rendering quality (anti-aliasing, stroke crispness, and scale behavior) before + visual effects work.

## How To Regenerate

Run:

```bash
cargo test verification::rendering_quality::generate_visual_reference -- --ignored --nocapture
Visual Inspection Checklist
- Curves: no stair-stepping on Bezier curves at 1x/2x/3x (zoom in and pan along long edges)
- Strokes: 1px strokes look crisp (no gray blur) at typical viewer zoom levels
- Text: labels remain readable; glyph edges look smooth (not jagged)
Expected Passing Characteristics
- Smooth edges on curves and node outlines (anti-aliasing active)
- 2x and 3x PNGs are exact pixel-scale multiples of 1x
- SVG
viewBox+preserveAspectRatiopreserve layout when viewport size changes
Source
- Topology:
examples/topologies/basic.yaml - Renderer:
src/render/svg.rsviaSvgRenderer::render
Metadata
- Generated (unix seconds): 1770157724
### basic_topology.py

```python
#!/usr/bin/env python3
"""Basic topology example using NetVis Python bindings.

This example demonstrates:
- Creating a topology with nodes and edges
- Using the attrs parameter for custom metadata
- Using different layout algorithms
- Rendering to SVG, PNG, and PDF
"""

import netvis


def main():
    # Create a simple spine-leaf datacenter topology
    topo = netvis.Topology()

    # Add spine switches with custom attrs for inventory tracking
    topo.add_node(
        "spine-1",
        node_type="switch",
        label="Spine 1",
        attrs={
            "vendor": "arista",
            "model": "7050X3",
            "rack": "R01",
            "serial": "SPN001ABC",
            "mgmt_ip": "10.0.0.1",
        },
    )
    topo.add_node(
        "spine-2",
        node_type="switch",
        label="Spine 2",
        attrs={
            "vendor": "arista",
            "model": "7050X3",
            "rack": "R01",
            "serial": "SPN002DEF",
            "mgmt_ip": "10.0.0.2",
        },
    )

    # Add leaf switches
    for i in range(1, 5):
        topo.add_node(
            f"leaf-{i}",
            node_type="switch",
            label=f"Leaf {i}",
            attrs={
                "vendor": "arista",
                "model": "7280R3",
                "rack": f"R0{((i - 1) // 2) + 2}",
                "serial": f"LEF{i:03d}XYZ",
            },
        )

    # Add servers with custom attributes
    for i in range(1, 9):
        leaf_num = ((i - 1) // 2) + 1
        topo.add_node(
            f"server-{i}",
            node_type="server",
            label=f"Server {i}",
            attrs={
                "os": "ubuntu-22.04",
                "cpu_cores": 64,
                "memory_gb": 256,
                "role": "compute" if i % 2 == 0 else "storage",
            },
        )
        # Add edge with cable/connection metadata
        topo.add_edge(
            f"server-{i}",
            f"leaf-{leaf_num}",
            from_interface="eno1",
            to_interface=f"Eth1/{i % 48}",
            attrs={"speed": "25G", "cable_type": "DAC", "length_m": 3},
        )

    # Connect leaves to spines (full mesh) with fabric links
    for leaf in range(1, 5):
        topo.add_edge(
            f"leaf-{leaf}",
            "spine-1",
            from_interface="Eth1/49",
            to_interface=f"Eth1/{leaf}",
            attrs={
                "speed": "100G",
                "cable_type": "single-mode-fiber",
                "length_m": 15,
                "circuit_id": f"FAB-L{leaf}-S1",
            },
        )
        topo.add_edge(
            f"leaf-{leaf}",
            "spine-2",
            from_interface="Eth1/50",
            to_interface=f"Eth1/{leaf}",
            attrs={
                "speed": "100G",
                "cable_type": "single-mode-fiber",
                "length_m": 15,
                "circuit_id": f"FAB-L{leaf}-S2",
            },
        )

    print(f"Topology: {topo.node_count()} nodes, {topo.edge_count()} edges")

    # Render with different layouts
    print("Rendering with hierarchical layout...")
    topo.render_to_file("spine-leaf-hierarchical.svg", layout="hierarchical")

    print("Rendering with force-directed layout...")
    topo.render_to_file("spine-leaf-force.svg", layout="force-directed")

    print("Rendering to PNG...")
    topo.render_to_file("spine-leaf.png", layout="hierarchical", scale=2.0)

    print("Done! Check output files.")


if __name__ == "__main__":
    main()
netbox_integration.py
#!/usr/bin/env python3
"""Example: Structuring NetBox-style data for NetVis visualization.

This example demonstrates the PATTERN for using NetVis with data from
Network Management Systems (NMS) like NetBox, Infrahub, or Nautobot.

NOTE: Direct API integration is intentionally not included in NetVis.
You should:
1. Query your NMS using its Python client (pynetbox, infrahub-sdk, etc.)
2. Transform the data into the format shown below
3. Pass it to NetVis for visualization

This separation of concerns keeps NetVis focused and avoids dependencies
on specific NMS versions, authentication schemes, and API changes.

Example workflow in your script:
    # 1. Query your NMS yourself
    # (e.g., get devices and connections for a site)
    devices = query_devices_from_nms(...)
    links = query_links_from_nms(...)

    # 2. Transform to NetVis format (as shown in mock_topology below)
    topo = transform_nms_to_netvis(devices, links)

    # 3. Render
    topo.render_to_file('topology.svg')
"""

import netvis


def mock_topology() -> netvis.Topology:
    """Create a mock topology demonstrating NMS data patterns.

    This simulates data you would get from an NMS query, showing:
    - How to preserve NMS metadata in attrs
    - Common device attributes (status, serial, platform, rack, IP)
    - Cable/connection attributes (type, status, length)

    In your real script, replace this with data from your NMS query.
    """
    return netvis.Topology.from_dict(
        {
            "nodes": [
                {
                    "id": "dc1-spine-01",
                    "type": "switch",
                    "label": "DC1 Spine 01",
                    # Preserve NMS metadata in attrs for downstream use
                    # (e.g., click handlers, tooltips, reports)
                    "attrs": {
                        "netbox_id": 101,
                        "status": "active",
                        "serial": "ABC123",
                        "platform": "arista-eos",
                        "rack": "R01",
                        "primary_ip": "10.0.0.1/32",
                    },
                },
                {
                    "id": "dc1-spine-02",
                    "type": "switch",
                    "label": "DC1 Spine 02",
                    "attrs": {
                        "netbox_id": 102,
                        "status": "active",
                        "serial": "ABC124",
                        "platform": "arista-eos",
                        "rack": "R01",
                        "primary_ip": "10.0.0.2/32",
                    },
                },
                {
                    "id": "dc1-leaf-01",
                    "type": "switch",
                    "label": "DC1 Leaf 01",
                    "attrs": {
                        "netbox_id": 201,
                        "status": "active",
                        "serial": "DEF456",
                        "platform": "arista-eos",
                        "rack": "R02",
                    },
                },
                {
                    "id": "dc1-leaf-02",
                    "type": "switch",
                    "label": "DC1 Leaf 02",
                    "attrs": {
                        "netbox_id": 202,
                        "status": "active",
                        "serial": "DEF457",
                        "platform": "arista-eos",
                        "rack": "R02",
                    },
                },
                {
                    "id": "dc1-srv-01",
                    "type": "server",
                    "label": "Web Server 01",
                    "attrs": {
                        "netbox_id": 301,
                        "status": "active",
                        "tenant": "web-team",
                        "platform": "linux",
                    },
                },
                {
                    "id": "dc1-srv-02",
                    "type": "server",
                    "label": "Web Server 02",
                    "attrs": {
                        "netbox_id": 302,
                        "status": "active",
                        "tenant": "web-team",
                        "platform": "linux",
                    },
                },
                {
                    "id": "dc1-fw-01",
                    "type": "firewall",
                    "label": "Firewall",
                    "attrs": {
                        "netbox_id": 401,
                        "status": "active",
                        "platform": "panos",
                    },
                },
            ],
            "edges": [
                {
                    "source": "dc1-leaf-01",
                    "target": "dc1-spine-01",
                    "from_interface": "Eth1/49",
                    "to_interface": "Eth1/1",
                    # Preserve cable metadata from NetBox
                    "attrs": {
                        "netbox_cable_id": 1001,
                        "cable_type": "smf",
                        "cable_status": "connected",
                        "cable_length": 10,
                        "cable_length_unit": "m",
                    },
                },
                {
                    "source": "dc1-leaf-01",
                    "target": "dc1-spine-02",
                    "from_interface": "Eth1/50",
                    "to_interface": "Eth1/1",
                    "attrs": {
                        "netbox_cable_id": 1002,
                        "cable_type": "smf",
                        "cable_status": "connected",
                    },
                },
                {
                    "source": "dc1-leaf-02",
                    "target": "dc1-spine-01",
                    "from_interface": "Eth1/49",
                    "to_interface": "Eth1/2",
                    "attrs": {
                        "netbox_cable_id": 1003,
                        "cable_type": "smf",
                        "cable_status": "connected",
                    },
                },
                {
                    "source": "dc1-leaf-02",
                    "target": "dc1-spine-02",
                    "from_interface": "Eth1/50",
                    "to_interface": "Eth1/2",
                    "attrs": {
                        "netbox_cable_id": 1004,
                        "cable_type": "smf",
                        "cable_status": "connected",
                    },
                },
                {
                    "source": "dc1-srv-01",
                    "target": "dc1-leaf-01",
                    "from_interface": "eno1",
                    "to_interface": "Eth1/1",
                    "attrs": {
                        "netbox_cable_id": 2001,
                        "cable_type": "cat6a",
                        "cable_status": "connected",
                    },
                },
                {
                    "source": "dc1-srv-02",
                    "target": "dc1-leaf-02",
                    "from_interface": "eno1",
                    "to_interface": "Eth1/1",
                    "attrs": {
                        "netbox_cable_id": 2002,
                        "cable_type": "cat6a",
                        "cable_status": "connected",
                    },
                },
                {
                    "source": "dc1-fw-01",
                    "target": "dc1-spine-01",
                    "from_interface": "eth0",
                    "to_interface": "Eth1/48",
                    "attrs": {
                        "netbox_cable_id": 3001,
                        "cable_type": "smf",
                        "cable_status": "connected",
                    },
                },
            ],
        }
    )


def main():
    """Demonstrate the pattern for NMS integration."""
    print("NetVis + NMS Integration Pattern")
    print("=" * 40)
    print()
    print("This example shows how to structure data from NetBox/Infrahub/Nautobot")
    print("for visualization with NetVis.")
    print()
    print("In your script, you would:")
    print("  1. Query your NMS using its Python client")
    print("  2. Transform results to the format shown in mock_topology()")
    print("  3. Pass to NetVis for rendering")
    print()

    # Create topology from mock data (simulating NMS query results)
    topo = mock_topology()

    print(f"Topology: {topo.node_count()} nodes, {topo.edge_count()} edges")

    # Render with hierarchical layout (good for datacenter topologies)
    topo.render_to_file(
        "netbox-topology.svg", layout="hierarchical", width=1400, height=900
    )
    print("Saved: netbox-topology.svg")

    # Also render as PNG for documentation
    topo.render_to_file("netbox-topology.png", layout="hierarchical", scale=2.0)
    print("Saved: netbox-topology.png")


if __name__ == "__main__":
    main()
README.md
# Sample Topologies

This directory contains copy/paste-friendly topology examples in both JSON and YAML formats, plus the `netvis` CLI binary that renders them to SVG.

## Getting Started

**New to NetVis?** Start with the progressive JSON tutorial series:

1. **[01-minimal.json](01-minimal.json)** - Absolute minimal 3-node example
2. **[02-basic-features.json](02-basic-features.json)** - Node types, edge labels, and attributes
3. **[03-aws-vpc.json](03-aws-vpc.json)** - Production AWS VPC architecture
4. **[04-kubernetes-cluster.json](04-kubernetes-cluster.json)** - K8s cluster with control plane
5. **[05-microservices.json](05-microservices.json)** - E-commerce microservices architecture

**Real-world scenario examples:**

- **[06-cdn-topology.json](06-cdn-topology.json)** - Global CDN with edge locations and cache hierarchy
- **[07-office-network.json](07-office-network.json)** - Corporate office with WiFi, VoIP, and IoT segments
- **[08-hybrid-cloud.json](08-hybrid-cloud.json)** - Hybrid cloud with on-premises and AWS integration

**Legacy examples:**

- **[tiny-network.json](tiny-network.json)** - Simple 5-node star topology
- **[medium-network.json](medium-network.json)** - ~50-node campus network
- **[datacenter-spine-leaf.json](datacenter-spine-leaf.json)** - Spine-leaf datacenter topology

## 🎯 Feature Showcases (YAML)

**Production-scale examples demonstrating specific NetVis capabilities:**

### Multi-Layer Clustering
**[showcase-multilayer-clustering.yaml](showcase-multilayer-clustering.yaml)** - 50+ node datacenter with 4 hierarchical layers

- Core spine switches (tier 1)
- Distribution aggregation switches (tier 2)
- Access top-of-rack switches (tier 3)
- Server/storage/database workloads (tier 4)
- 3 distinct pods with natural clustering patterns
- Cross-pod traffic demonstrating inter-cluster communication

```bash
# Render with Louvain clustering algorithm
cargo run --bin netvis -- \
  --input examples/topologies/showcase-multilayer-clustering.yaml \
  --output target/showcase-multilayer-clustering.svg \
  --width 2000 --height 1600 \
  --cluster --algorithm louvain --granularity medium \
  --verbose
Edge Bundling
showcase-edge-bundling.yaml - 40+ node global service mesh with dense connectivity
- Hierarchical hub-and-spoke topology
- 5 regional hubs, 15 edge locations, 12 service endpoints
- Many-to-many connections creating visual complexity
- Perfect demonstration of edge bundling reducing clutter
- Cross-region replication and data flows
# Render with hierarchical edge bundling
cargo run --bin netvis -- \
  --input examples/topologies/showcase-edge-bundling.yaml \
  --output target/showcase-edge-bundling.svg \
  --width 2200 --height 1600 \
  --verbose
Geographic Layout
showcase-geographic.yaml - 21-city global WAN with real-world coordinates
- Major cities across 6 continents
- Position hints matching real geographic locations
- Undersea fiber optic cables (trans-Atlantic, trans-Pacific)
- Regional terrestrial networks
- Actual cable names and latency measurements
# Render with geographic positioning
cargo run --bin netvis -- \
  --input examples/topologies/showcase-geographic.yaml \
  --output target/showcase-geographic.svg \
  --width 2400 --height 1200 \
  --verbose
Radial Layout
showcase-radial-layout.yaml - 85-node radial topology with 5 concentric rings
- Perfect radial symmetry from central controller
- 4 regional coordinators (cardinal directions)
- 8 zone controllers, 24 edge nodes, 48 services
- Demonstrates natural hub-and-spoke patterns
- Ideal for service distribution architectures
# Render with radial layout
cargo run --bin netvis -- \
  --input examples/topologies/showcase-radial-layout.yaml \
  --output target/showcase-radial-layout.svg \
  --width 2000 --height 2000 \
  --verbose
Hierarchical Layout
showcase-hierarchical-layout.yaml - 80-node enterprise org chart
- 5-level strict hierarchy (CEO → VP → Director → Manager → Team)
- Enterprise organizational structure
- Engineering, Operations, and Sales divisions
- Cross-functional collaboration edges
- Perfect tree structure demonstration
# Render with hierarchical layout
cargo run --bin netvis -- \
  --input examples/topologies/showcase-hierarchical-layout.yaml \
  --output target/showcase-hierarchical-layout.svg \
  --width 2200 --height 1800 \
  --verbose
Constraints System
showcase-constraints.yaml - Constraint system demonstration
- Region constraints - Security zones (DMZ, internal, database, management)
- Alignment constraints - Horizontally aligned load balancers, vertically aligned cache tiers
- Proximity constraints - Latency-sensitive services grouped together
- Keep-apart constraints - HA DNS servers with minimum separation
# Render with constraints applied
cargo run --bin netvis -- \
  --input examples/topologies/showcase-constraints.yaml \
  --output target/showcase-constraints.svg \
  --width 2000 --height 1400 \
  --verbose
Mixed-Algorithm Layouts
mixed-layout-wan-dc.yaml - WAN backbone + datacenter with composite layout
- WAN backbone using force-directed layout for organic positioning
- Datacenter groups using hierarchical layout for spine-leaf structure
- Demonstrates per-group algorithm assignment via
layout:field - 20 nodes across 3 groups showing composition benefits
mixed-layout-campus.yaml - Campus network with nested hierarchy
- Building root using radial layout (building-centric view)
- Floor groups using hierarchical layout (closet distribution)
- Shows nested group structure with mixed algorithms
- 17 nodes demonstrating hierarchical composition
# Note: Full CLI integration for composite layout is in progress
# These examples demonstrate the YAML schema and topology structure
# for mixed-algorithm layouts. Rendering requires CompositeLayout
# implementation to be wired into the binary crate.

# Planned usage (once CLI integration complete):
# cargo run --bin netvis -- \
#   --input examples/topologies/mixed-layout-wan-dc.yaml \
#   --output target/mixed-layout-wan-dc.svg \
#   --layout composite \
#   --width 2000 --height 1400
🌍 Regional Geographic Networks
Detailed regional topologies with real Internet Exchanges and connectivity:
European Network
regional-europe.yaml - 20 European IXPs and major fiber rings
- Tier 1: DE-CIX Frankfurt, LINX London, AMS-IX Amsterdam
- Regional hubs across 15+ countries
- Nordic ring, Western Europe ring, Eastern Europe connections
- Real IX traffic statistics and peering data
cargo run --bin netvis -- \
  --input examples/topologies/regional-europe.yaml \
  --output target/regional-europe.svg \
  --width 1400 --height 1000
Asian Network
regional-asia.yaml - 22 Asian cities with undersea cable systems
- Major hubs: Tokyo, Singapore, Hong Kong, Sydney, Mumbai
- Southeast Asia ring, Indian subcontinent, Australia/Oceania
- Real undersea cables (APG, SEA-ME-WE-5, Southern Cross, i2i)
- Cable capacities and latency measurements
cargo run --bin netvis -- \
  --input examples/topologies/regional-asia.yaml \
  --output target/regional-asia.svg \
  --width 1600 --height 1000
North American Network
regional-north-america.yaml - US, Canada, Mexico interconnection
- Tier 1 US hubs with Equinix IXPs
- Canadian transcontinental network
- US-Canada and US-Mexico border crossings
- East coast, central, and west coast backbone routes
cargo run --bin netvis -- \
  --input examples/topologies/regional-north-america.yaml \
  --output target/regional-north-america.svg \
  --width 1200 --height 800
Schema Reference
See docs/topology-format.md for the complete topology file format reference, including:
- Full YAML/JSON schema with all fields documented
- Annotated examples you can copy and modify
- Node types reference table
- Tips and best practices
Quick Start - Render JSON Examples
All commands write an SVG file and print the output path. NetVis accepts both JSON and YAML formats.
Minimal example (3 nodes):
cargo run --bin netvis -- \
  --input examples/topologies/01-minimal.json \
  --output target/01-minimal.svg
AWS VPC architecture:
cargo run --bin netvis -- \
  --input examples/topologies/03-aws-vpc.json \
  --output target/aws-vpc.svg \
  --width 1400 --height 1000
Kubernetes cluster:
cargo run --bin netvis -- \
  --input examples/topologies/04-kubernetes-cluster.json \
  --output target/k8s-cluster.svg \
  --width 1600 --height 1200
Microservices architecture:
cargo run --bin netvis -- \
  --input examples/topologies/05-microservices.json \
  --output target/microservices.svg \
  --width 1600 --height 1400
Office network with VoIP and IoT:
cargo run --bin netvis -- \
  --input examples/topologies/07-office-network.json \
  --output target/office-network.svg \
  --width 1800 --height 1200
Hybrid cloud architecture:
cargo run --bin netvis -- \
  --input examples/topologies/08-hybrid-cloud.json \
  --output target/hybrid-cloud.svg \
  --width 2000 --height 1400
Render all JSON examples at once:
cargo run --bin netvis -- \
  --input "examples/topologies/*.json" \
  --output target/json-examples/
Help / supported flags:
cargo run --bin netvis -- --help
YAML Examples
Basic:
cargo run --bin netvis -- \
  --input examples/topologies/basic.yaml \
  --output target/basic.svg
Multi-layer (using a wide-area layout preset):
cargo run --bin netvis -- \
  --input examples/topologies/multi-layer.yaml \
  --output target/multi-layer.svg \
  --preset wan
Datacenter (preset + explicit size):
cargo run --bin netvis -- \
  --input examples/topologies/datacenter.yaml \
  --output target/datacenter.svg \
  --preset datacenter \
  --width 1400 \
  --height 900
Feature Showcase YAML Examples
These examples demonstrate specific NetVis features and layout algorithms:
Layout algorithms:
cargo run --bin netvis -- --input examples/topologies/hierarchical-showcase.yaml --output target/hierarchical.svg
cargo run --bin netvis -- --input examples/topologies/force-directed-showcase.yaml --output target/force-directed.svg
cargo run --bin netvis -- --input examples/topologies/radial-layout-showcase.yaml --output target/radial.svg
Edge bundling:
cargo run --bin netvis -- --input examples/topologies/edge-bundling-showcase.yaml --output target/edge-bundling.svg
cargo run --bin netvis -- --input examples/topologies/hierarchical-bundling-showcase.yaml --output target/hierarchical-bundling.svg
Clustering and community detection:
cargo run --bin netvis -- --input examples/topologies/clustering-showcase.yaml --output target/clustering.svg \
  --cluster --algorithm louvain --granularity medium --verbose
Visual effects:
cargo run --bin netvis -- --input examples/topologies/effects-showcase.yaml --output target/effects.svg
cargo run --bin netvis -- --input examples/topologies/theme-showcase.yaml --output target/themes.svg
Constraints and positioning:
cargo run --bin netvis -- --input examples/topologies/constraint-showcase.yaml --output target/constraints.svg
cargo run --bin netvis -- --input examples/topologies/geographic-wan-showcase.yaml --output target/geographic-wan.svg
Metrics and attributes:
cargo run --bin netvis -- --input examples/topologies/metrics-showcase.yaml --output target/metrics.svg
cargo run --bin netvis -- --input examples/topologies/interface-showcase.yaml --output target/interfaces.svg
Real-World YAML Examples
Production-scale network topologies:
cargo run --bin netvis -- --input examples/topologies/datacenter-large.yaml --output target/datacenter-large.svg
cargo run --bin netvis -- --input examples/topologies/enterprise-campus.yaml --output target/enterprise-campus.svg
cargo run --bin netvis -- --input examples/topologies/isp-backbone.yaml --output target/isp-backbone.svg
cargo run --bin netvis -- --input examples/topologies/wan-multi-site-large.yaml --output target/wan-multi-site.svg
Gallery Examples
Polished examples for screenshots and documentation:
# Render all gallery examples
cargo run --bin netvis -- --input "examples/topologies/gallery-*.yaml" --output target/gallery/
Render Everything
# Render all YAML examples
cargo run --bin netvis -- --input "examples/topologies/*.yaml" --output target/yaml-examples/

# Render all JSON and YAML examples
cargo run --bin netvis -- --input "examples/topologies/*.{json,yaml}" --output target/all-examples/
Convert SVG To PNG/PDF (Optional)
These conversions are external to netvis.
PNG via librsvg (rsvg-convert):
rsvg-convert -w 2000 -o target/datacenter.png target/datacenter.svg
PDF via Inkscape:
inkscape target/datacenter.svg --export-type=pdf --export-filename=target/datacenter.pdf
---
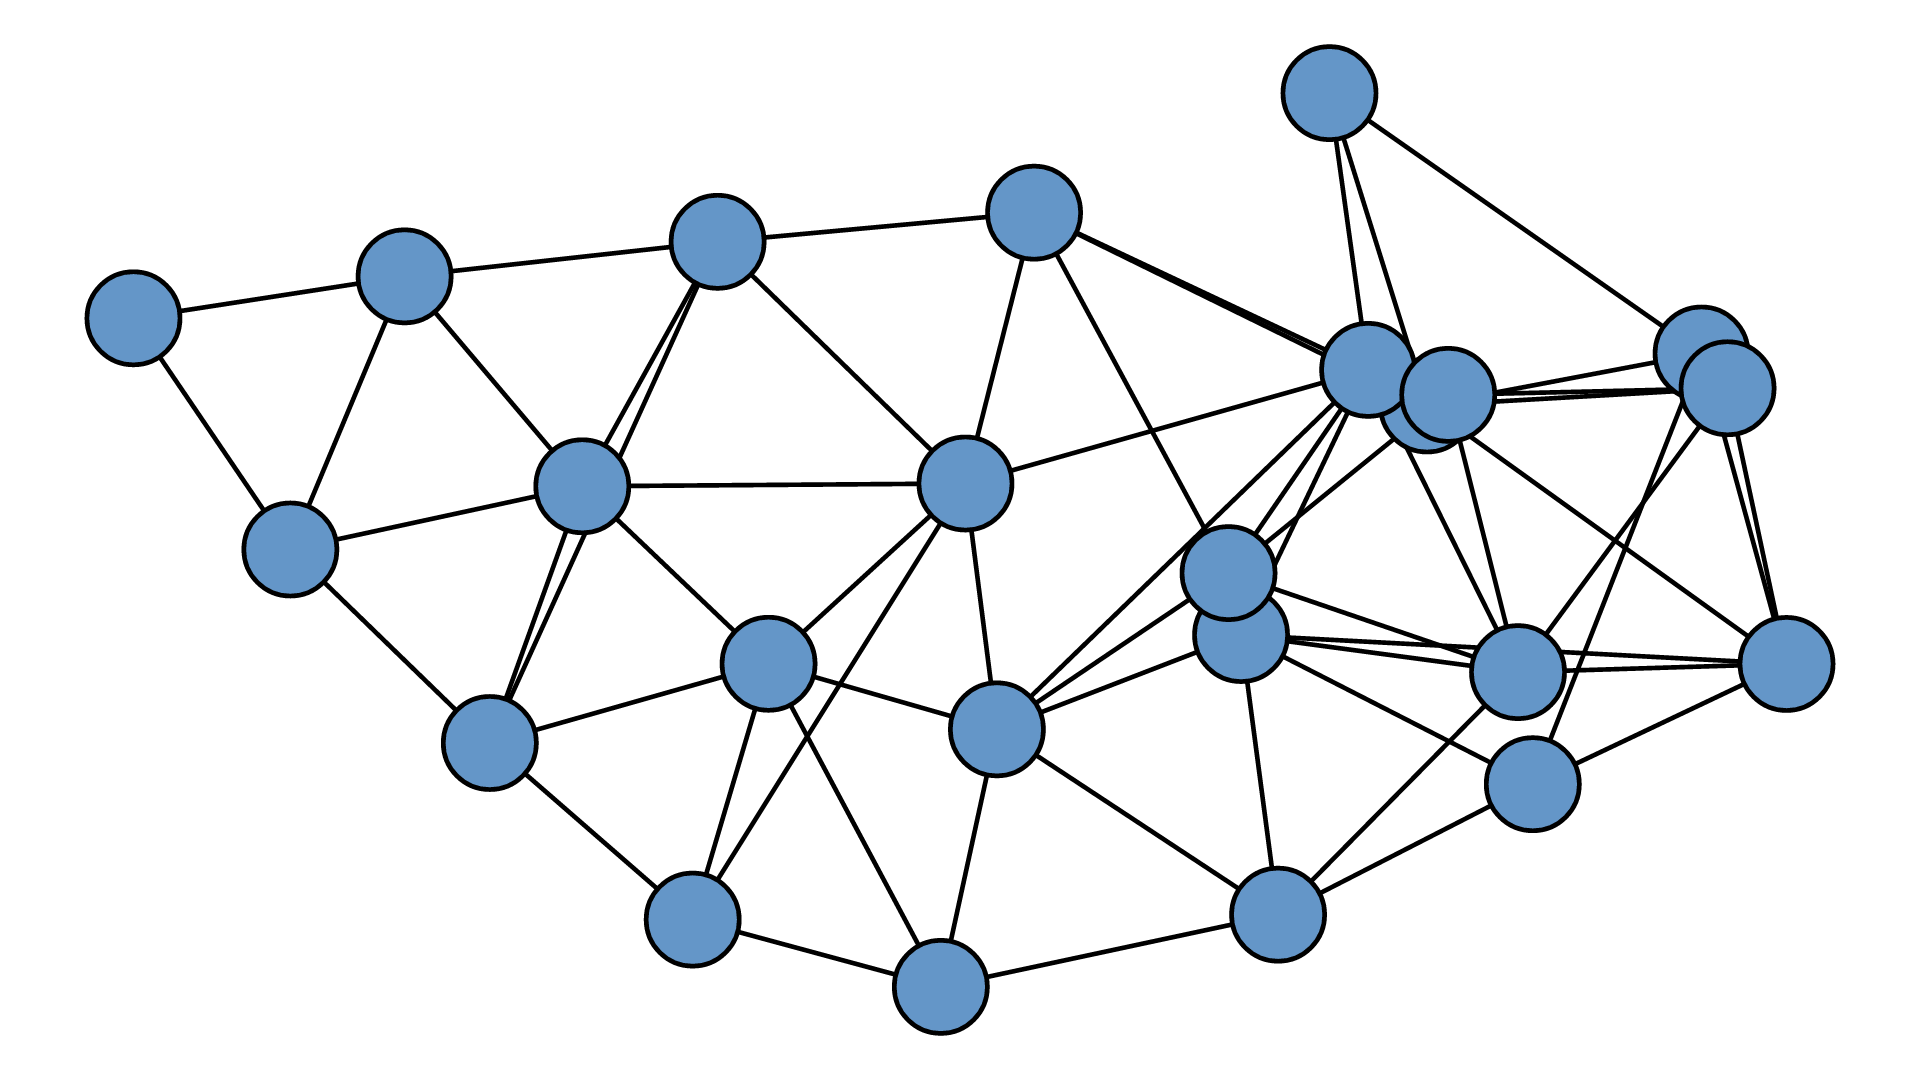
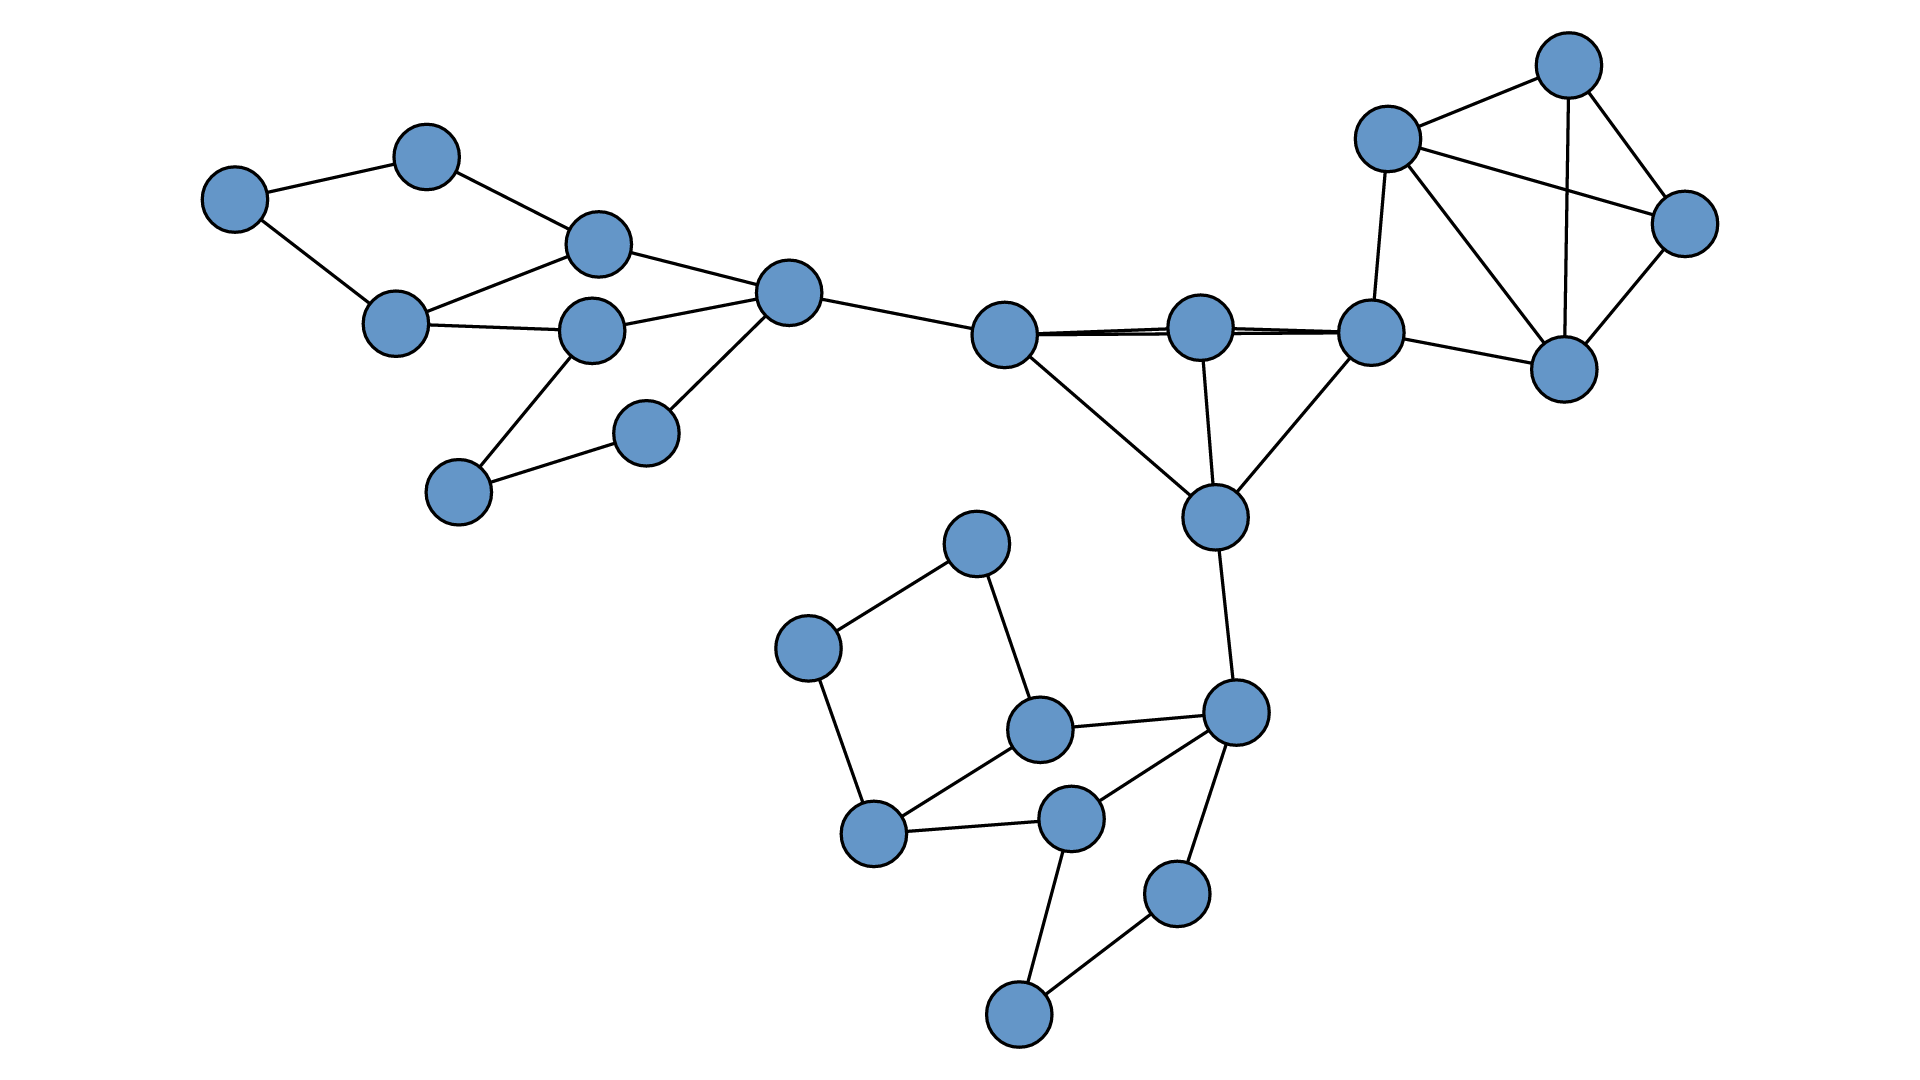
## Visuals
### Network Visualisation Examples


---
## Usage
```bash
# Render a topology to SVG
netvis --input topology.yaml --output network.svg
# Geographic layout
netvis --input backbone.yaml --layout geographic --output map.svg
# Multi-layer isometric view
netvis --input datacenter.yaml --layout isometric --layers physical,l2,ospf --output layers.svg
# Import from LLDP discovery
netvis import --format lldp --input discovery.json --output topology.yaml
# Timeline across snapshots
netvis timeline --input snapshots/ --output timeline.svg
Features
Rendering:
- SVG, PDF, PNG output
- WASM target for browser embedding
- SVG filter effects (drop shadows, glow) with Tufte-inspired guardrails
- Effect budget system prevents performance cliffs on large topologies
- Signature-based filter deduplication reduces SVG file size
Analysis:
- Path highlighting via BFS
- Traffic utilization overlays with NOC color mapping
- Timeline mode for multi-snapshot SVG export with incremental diffs
- Temporal entity queries (when did a node appear/change/disappear)
- Filter by type, tag, group, or layer without re-running layout
Integration:
- Python bindings via PyO3
- YAML/JSON topology input
- Adapters for LLDP/CDP discovery JSON and NetBox import
- Contract-versioned API for stable embedding
Quick Facts
| Status | Recently Updated |
| Stack | Rust, Python, TypeScript |
What This Is
A Rust-based network topology layout and visualization engine. Takes complex multi-layer network topologies (via petgraph) and renders them using advanced layout algorithms that reduce visual complexity while preserving structural clarity. Outputs static formats (SVG, PDF, PNG) for v1, with interactive browser embedding planned for future integration with other tooling.
Core Value
Transform network topologies into clear, information-dense visualizations using algorithms that minimize edge crossings, bundle related connections, and respect hierarchical/geographic structure — enabling understanding of networks that would otherwise be visual noise.
Current Milestone: v1.8 - Temporal & Interaction
Goal: Transform NetVis into a complete network visualization toolkit by adding temporal analysis, interactive filtering, live monitoring, and diagram annotation capabilities.
Target features:
- Time-series topology evolution - Scrub timeline to visualize network changes over time, highlight diffs between snapshots, export evolution animations, query “when did X appear”
- Interactive query/filtering - Show/hide by device type, protocol layer, tag/group; path/connectivity queries without re-layout
- Live traffic flow animation - CSS-animated pulses for NOC displays, presentations, simulation playback, and performance/utilization visualization
- Annotation & markup - Text notes, visual callouts (circles/arrows/boxes), persistent storage, layered annotations with show/hide
Strategic vision: v1.8 establishes the interaction foundation (temporal + filtering + annotation) that v1.9 will build upon with 3D visualization, tiled exports, and collaboration features.
Out of scope:
- Real-time data source integration (no live SNMP/NetFlow collection) - users provide traffic data
- Multi-user collaborative editing - single-user annotation only (multi-user deferred to v1.9)
- Web-based topology editor - visualization-focused, topology authoring stays CLI/code-based
- Advanced 3D rendering - current isometric projection only (full 3D rotation/perspective deferred to v1.9)
Previous Milestones:
- v1.7 - Interactive Browser Editor
- v1.4 - Production Scale & Real-World Integration
- v1.3 - Embed Readiness & API Stability
- v1.2 - Visual Polish & Production Hardening
- v1.1 - Network Analysis & Operations
- v1.0.0 - Release Preparation
Requirements
# Validated
All features from original roadmap:
- ✓ petgraph-based input API for topology definition
- ✓ Isometric multi-layer layout (Physical → L2 → IP → OSPF → iBGP → eBGP stacking)
- ✓ Edge bundling (hierarchical and force-directed bundling algorithms)
- ✓ Bezier edge routing with crossing/collision reduction
- ✓ Starburst/radial layout for containment groups (ASes, data centers, VLANs)
- ✓ Force-directed positioning with weighted edges (peering-aware, using fjadra)
- ✓ Radial tree layout for hierarchical structures
- ✓ Multiple node type support (routers, switches, servers, broadcast domains)
- ✓ Edge weight visualization (line thickness, style differentiation)
- ✓ SVG output
- ✓ PDF output
- ✓ PNG output
- ✓ Configuration API for layout selection and parameters
- ✓ CLI tool with JSON/YAML topology loading
v1.2 Visual Polish & Production Hardening (shipped 2026-02-09):
- ✓ SVG filter infrastructure with signature-based deduplication — v1.2
- ✓ Visual effects (drop shadows, glow, gradients, inner shadows) with semantic guardrails — v1.2
- ✓ WCAG 3:1 non-text contrast enforcement via automated parameter tuning — v1.2
- ✓ High-Contrast theme with AAA (21:1) contrast and redundant emphasis channels — v1.2
- ✓ Label collision avoidance with perpendicular-FIRST edge placement strategy — v1.2
- ✓ Export quality diagnostics for SVG/PNG/PDF material diffs — v1.2
v1.3 Embed Readiness & API Stability (shipped 2026-02-16):
- ✓ Deterministic rendering with golden fixture suite (55 SVG + 8 PNG + 8 PDF baselines) — v1.3
- ✓ Structured diagnostics envelope (v1.0 schema) with JSON/YAML/NDJSON CLI output — v1.3
- ✓ Multi-surface embedding API: contracts::v1 boundary, Rust facade, WASM envelope — v1.3
- ✓ R*-tree spatial label placement with scored candidates and viewport-aware sizing — v1.3
- ✓ CI governance: overlap gate, API drift detection, SemVer checks, versioned JSON Schemas — v1.3
- ✓ Rust SVG quality analyzer with label distance metrics (zero Python dependency) — v1.3
# Active
v1.0.0 Release preparation:
- CLI user guide documentation
- Topology file format reference (JSON/YAML schema)
- Configuration file reference (NetVisConfig schema)
- Basic rustdoc on public APIs (module-level + core types)
- GitHub Actions CI pipeline (test, clippy, fmt, docs)
- Criterion benchmarks for layouts and rendering
- Package metadata for crates.io
- CHANGELOG.md for v1.0.0
- Security audit and preparation
# Out of Scope
v1.0 feature development (complete):
- Python bindings — deferred to v1.1+ after release
- Browser/WASM embedding — deferred to v1.1+
- Interactive features (click events, zoom, show/hide) — deferred to v1.1+
- Topology discovery/parsing — users provide topology files
- Real-time animation — static output only
v1.0.0 release scope exclusions:
- Comprehensive library API documentation — CLI-first, defer detailed rustdoc to v1.1
- Examples for Rust library usage — have CLI examples, defer programmatic examples
- Advanced benchmarking (GPU, parallelization) — basic criterion benchmarks only
- Multi-platform CI testing — Linux/macOS only initially
Planning Workflow
Inbox Processing:
Before starting milestone planning, review inbox.md in the project root for captured feature ideas and tasks. Categorize items as:
- Current milestone: Add to active requirements if critical
- Future milestone: Reference in out-of-scope or defer to next version
- Research needed: Flag for investigation before commitment
This ensures no ideas are lost and provides a backlog for future planning cycles.
Context
Background: This project builds on visualization concepts from academic work on Abstract Network Models, which represent networks across multiple protocol layers (Physical, Layer 2, IP Address, OSPF, iBGP, eBGP) with cross-layer associations. The goal is to make these visualizations programmatically accessible.
Related project: Will eventually integrate with a “Topology Visualisation and Querying” tool (React-based) as an embedded visualization component with bidirectional communication (click events out, highlight commands in). This informs the need to design for browser embedding even though it’s not v1 scope.
Inspiration sources:
- D3.js radial tree and hierarchical edge bundling
- Datashader/edgebundle hammer bundling algorithm
- Topology Zoo geographic network maps
- Edward Tufte’s principles on information density and visual clarity
- fjadra (Rust port of d3-force) for force simulation
Architecture vision:
[Topology Sources] → [Input/petgraph] → [Core Layout Engine] → [Output/Render]
                                               ↓
                                    Multiple layout algorithms
                                    composable and configurable
Constraints
- Language: Rust — required for performance of iterative layout algorithms (force-directed convergence, edge bundling optimization)
- Graph library: petgraph — well-maintained, performant, good API for network topology representation
- Force simulation: fjadra — Rust port of d3-force, WebAssembly-friendly, designed for interactive performance
- Design philosophy: Tufte-inspired — maximize information density, minimize chartjunk, clarity over decoration
Key Decisions
| Decision | Rationale | Outcome |
|---|---|---|
| Rust for implementation | Iterative algorithms (force-directed, bundling) need performance; future WASM target | ✓ Good (v1.2: 51K LOC, WASM working) |
| petgraph for graph structure | Mature, performant, good Rust ecosystem fit | ✓ Good |
| fjadra for force simulation | d3-force semantics in Rust, WASM-ready, active development | ✓ Good |
| Library-first architecture | Primary use case is programmatic generation, not GUI tool | ✓ Good |
| Static output for v1 | Reduce scope; interactive features layered on later | ✓ Good |
| Defer Python bindings | Get core right first; bindings are mechanical once API is stable | ✓ Good (shipped v1.1) |
| SVG filters over raster post-processing (v1.2) | Maintain vector fidelity, theme-aware, resolution-independent | ✓ Good |
| Tufte-first design philosophy (v1.2) | Effects must enhance information, not decorate | ✓ Good (semantic guardrails prevent chartjunk) |
| Effect budget system >50 elements (v1.2) | Prevent performance cliff from excessive SVG filters | ✓ Good (auto-disable with warnings) |
| Signature-based filter deduplication (v1.2) | Reduce SVG bloat, share identical filter definitions | ✓ Good (O(1) reuse lookup) |
| Quantized EffectParams buckets (v1.2) | Enable WCAG tuning while preserving filter dedup | ✓ Good (0..=10 buckets) |
| WCAG 3:1 automated enforcement (v1.2) | Accessibility compliance without manual tuning | ✓ Good (auto-adjust + numeric warnings) |
| Text-anchor alignment for labels (v1.2) | Break geometric constraint (close + side + no truncation) | ✓ Good (10px spacing vs 150-233px) |
| Perpendicular-FIRST offset strategy (v1.2) | Keep edge labels visually connected while avoiding strokes | ✓ Good (zero overlap warnings) |
Ecosystem Context
This project is part of a seven-tool network automation ecosystem. netvis provides topology visualization and rendering — the “visualize” stage of the pipeline.
Role: Render network topologies as high-quality static output (SVG/PNG/PDF) or interactive visualizations (WASM). Consume topology data from any upstream tool.
Key integration points:
- Renders topologies from topogen (YAML), ank-pydantic (JSON), or netflowsim (GeoJSON with stats)
- WASM target enables embedding directly in the workbench browser UI
- Python bindings (PyO3) for programmatic rendering in Python workflows
- Geographic layout mode consumes lat/lon coordinates from topogen’s geo module
- Contract-first versioned API (
contracts::v1) for stable embedding
Architecture documents:
- Ecosystem Architecture Overview — full ecosystem design, data flow, workflows
- Ecosystem Critical Review — maturity assessment, integration gaps, strategic priorities
Last updated: 2026-02-22 after v1.7 milestone initialization
Current Status
2026-02-24 — Completed 73-03-PLAN.md (Share URL encode/decode WASM API + tests)